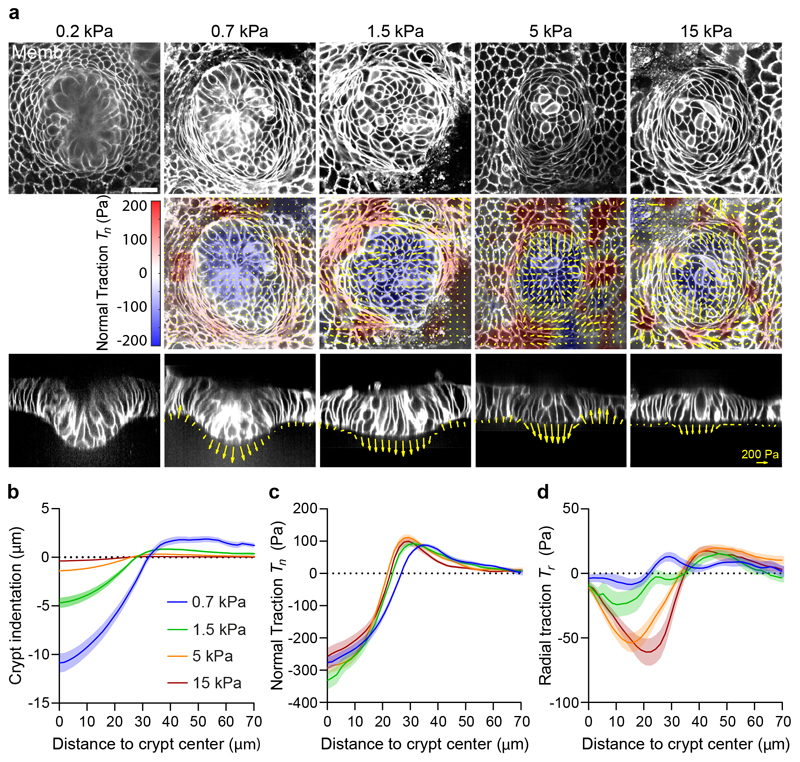
Fig. 2. A stiffness-independent normal traction folds the crypt.
a, Top: single confocal plane of representative crypts on substrates of increasing stiffness. Center: 3D traction maps. Yellow vectors represent components tangential to the substrate and the color map represents the component normal to the substrate. Bottom: lateral view along the crypt midline. Yellow vectors represent tractions. Scale bar, 20 μm. Scale vector, 200Pa. Representative images of n=14 (0.2kPa), 23 (0.7kPa), 23 (1.5kPa), 37 (5kPa) and 30 (15kPa) crypts from 2, 3, 3, 7 and 4 independent experiments, respectively. Crypt indentation (b), normal traction (c) and radial traction (d) as a function of the distance to the crypt center for substrates of different stiffness. Data are represented as mean ± SEM of n=23 (0.7kPa), 23 (1.5kPa), 37 (5kPa) and 30 (15kPa) for indentation (b) and n=14 (0.7kPa), 12 (1.5kPa), 36 (5kPa) and 30 (15kPa) crypts for tractions (c-d) from 3, 3, 7 and 4 independent experiments, respectively.

