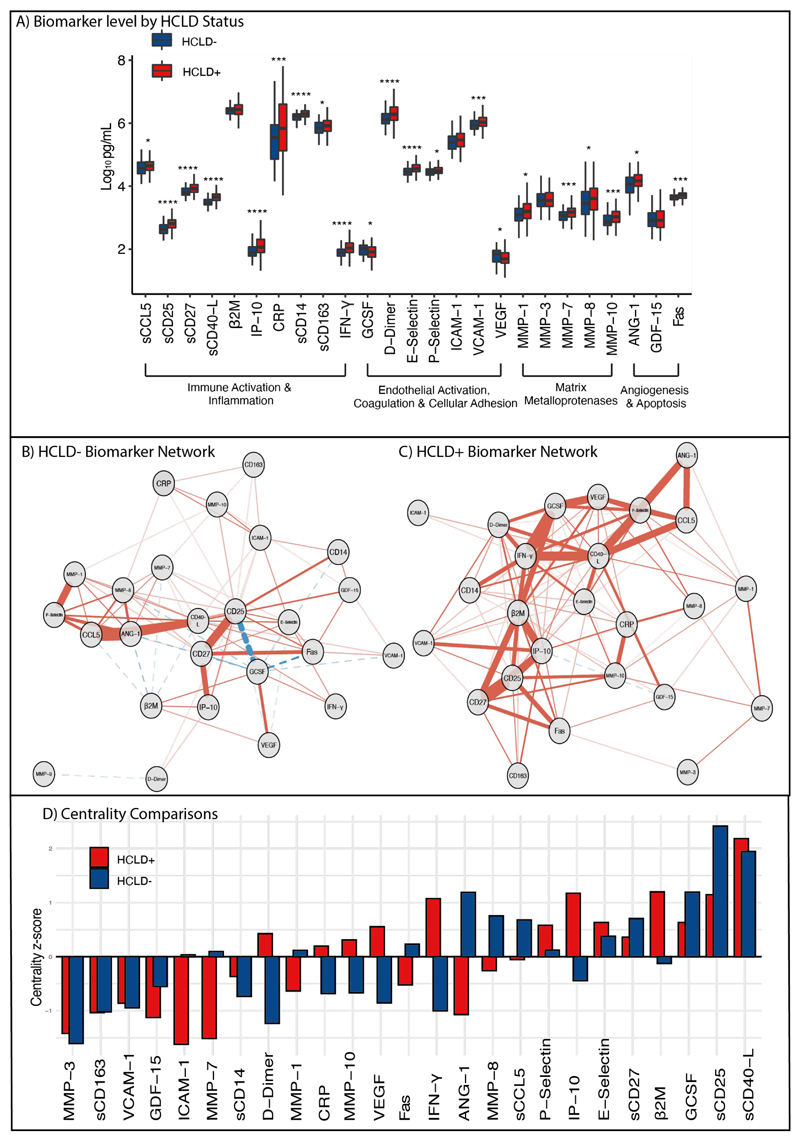
Figure 1.
Comparison of biomarkers in cases and controls. (a) Comparison of Log10 biomarker level between cases (HCLD-) and controls (HCLD+). Levels compared by Wilcoxon rank sum test. Stars represent significance level at 0.05 or less, 0.01 or less, 0.001 or less and 0.0001 or less, respectively. (b and c) Network plots showing strength and direction of correlations between biomarkers in HCLD- and HCLD+ individuals. Saturation and width of edges correspond to absolute weight and scale relative to strongest weight in the graph. Negative correlations displayed as dashed lines. Nodes are arranged by spring format. Only significant (P<0.05) correlations r2 more than 0.2 are shown. Correlation coefficients between biomarkers are reported in Supplementary figure 1 (d) Node strength centrality z scores for nodes in the networks. Score indicates the relative interconnectedness of each biomarker within the network.

