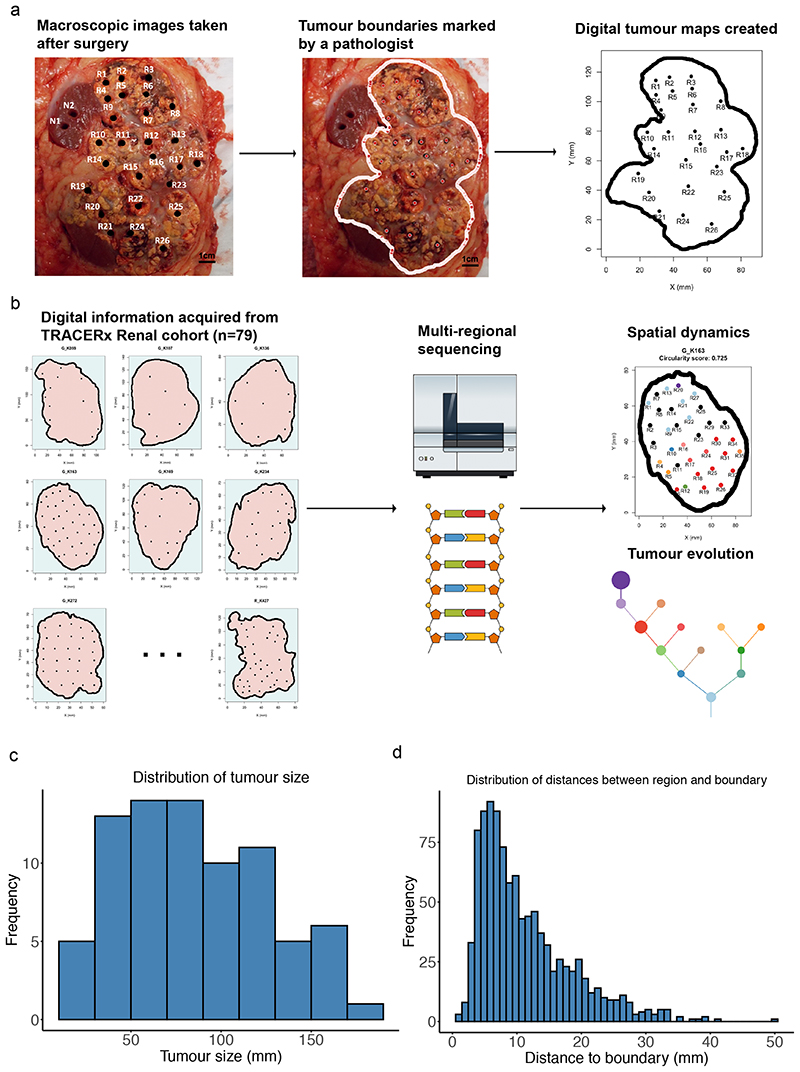
Figure 1. Study overview.
A) Macroscopic images taken after surgery were reviewed by a pathologist to determine the physical boundary between tumour and normal tissues, and spatial information was subsequently gathered to generate digital tumour maps. Scale bar shows 1 cm in length on the photograph. B) Spatial data were combined with multi-regional sequencing data to study spatial dynamics and tumour evolution. C) Distribution of tumour size measured in millimetres. D) Distribution of distances between each biopsy region and its nearest tumour boundary on the tumour maps, measured in millimetres.

