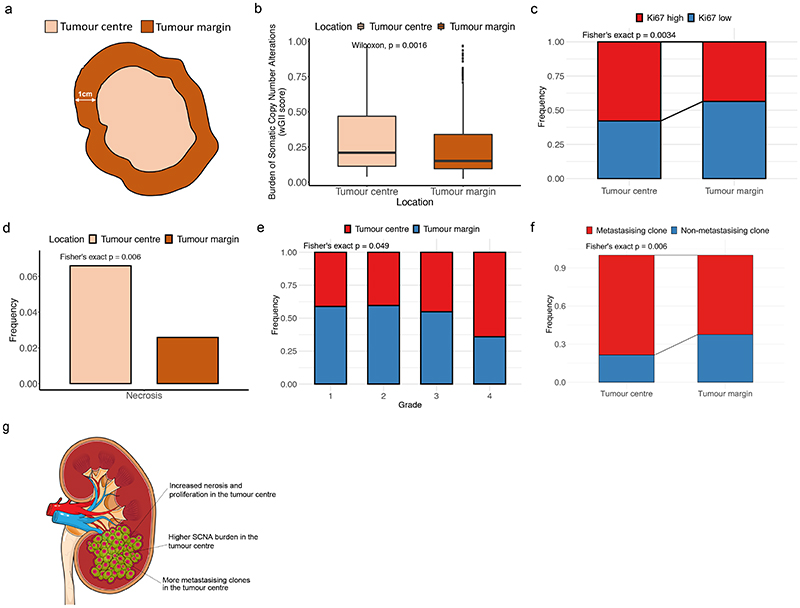
Figure 2. Comparison between regions in the tumour centre and regions in the tumour margin.
A) Definition of tumour centre and tumour margin. Biopsies less than 1 centimetre to its boundary were defined as marginal regions, while biopsies more than 1 centimetre to its boundary were defined as central regions. B) Comparison of weighted genome integrity index (wGII) which is a measurement of burden of somatic copy number alterations between tumour centre (n=323) and tumour margin (n=425). C) Comparison of Ki67 between tumour centre (n=204) and tumour margin (n=250). D) Comparison of frequency of necrotic regions between tumour centre (n=379) and tumour margin (n=464). E) Comparison of frequencies of regions of different Fuhrman grades in clear cell renal cell carcinoma between tumour centre and tumour margin (n=495). F) Comparison of frequencies of metastasising clones and non-metastasising clones between tumour centre (n=131) and tumour margin (n=128) in a subset of metastatic tumours. G) A cartoon summarizing the differences observed between tumour centre and tumour margin, which might be explained by the differences of blood supply of different parts of the tumour. In all boxplots in this figure the centre line is the median, the bounds of the box represent the inter-quartile range, the lower whisker = max(min(x), Q_1 – 1.5 × IQR) and upper whisker = min(max(x), Q_3 + 1.5 × IQR).

