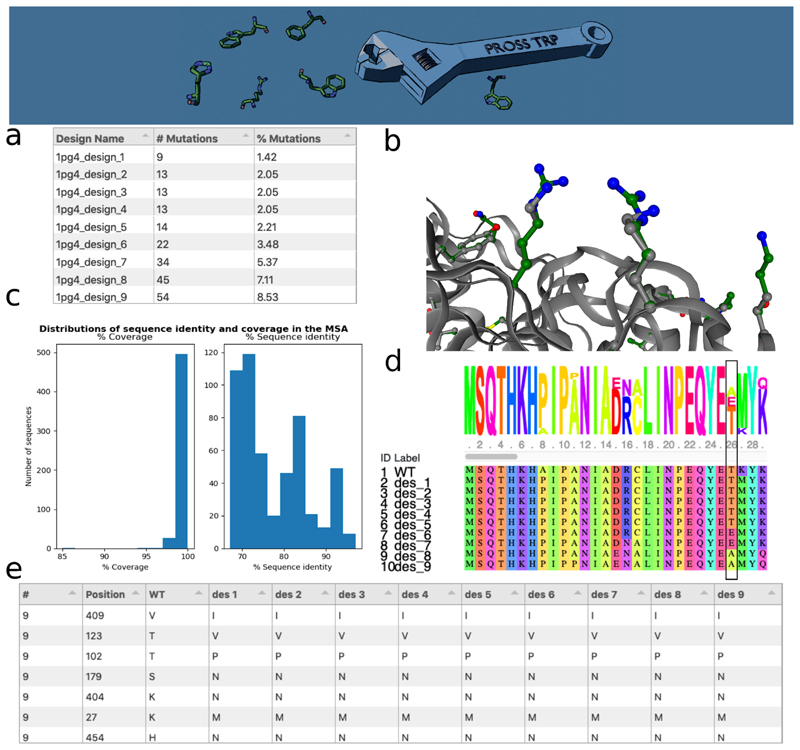
Figure 1. Features from the PROSS2 results page.
(a) A tabular summary of designs. (b) An interactive NGL rendering of the designed mutations (green sticks and balls) relative to the query (gray). (c) Histograms depicting the quality of the multiple sequence alignment according to their sequence diversity and coverage relative to the query sequence. (d) Sequence view comparing all designs to the query. (e) Part of a table reporting the identities at all mutated positions across the designs.

