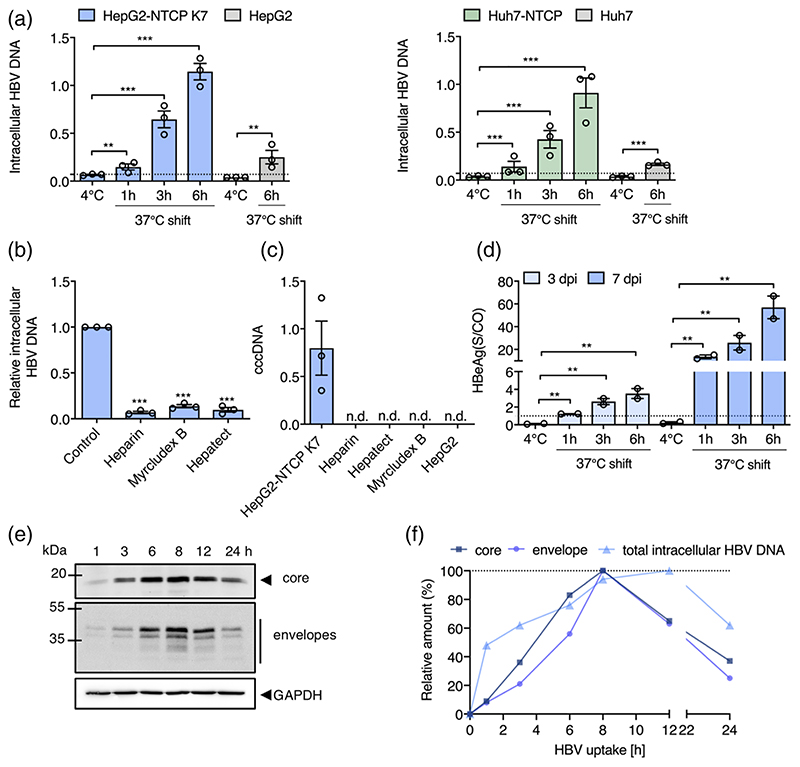
Figure 3. HBV internalisation kinetics.
(a) HBV internalisation is temperature and NTCP-dependent. HepG2 and Huh-7 hepatoma cells and those engineered to express NTCP were inoculated with HBV (MOI 200) and trypsinized after 1 h at 4°C or following incubation at 37°C for 1, 3 or 6 h. Intracellular HBV DNA levels are expressed relative to PRNP and the dotted line represents trypsinized 4°C samples that were set as background for the assay. (b) Receptor and HBV glycoprotein dependent particle internalisation. HepG2-NTCP K7 cells were inoculated with HBV (MOI 200) in the presence or absence of heparin (50 IU/mL), Myrcludex B (200 nM) or Hepatect (0.5 IU/mL) and trypsin-resistant intracellular HBV DNA copies measured after 6 h. Data are expressed relative untreated HepG2-NTCP cells. (c) Short-term synchronised HBV infection of HepG2-NTCP cells generates cccDNA. Parental HepG2 and HepG2-NTCP K7 cells were inoculated with HBV (MOI 200) as detailed above and after 6 h at 37°C cells were trypsinized and cultured at 37°C for 3 days before measuring cccDNA. Heparin (50 IU/mL), Hepatect (0.5 IU/mL) and Myrcludex B (200 nM) were included as controls. HBV cccDNA levels are expressed relative to PRNP and represent three independent experiments presented as mean ± SEM. (d) Association between internalised HBV particles and HBeAg expression. HepG2-NTCP K7 were inoculated with HBV (MOI 200) and trypsinized after 1 h at 4°C or following incubation at 37°C for 1, 3 or 6 h and the infected cells cultured for 3 or 7d before measuring extracellular HBeAg. Dotted line represents the limit of detection of the assay, where all values above 1 are considered positive. (e) HBV internalisation kinetics. HepG2-NTCP K7 cells were inoculated with HBV (MOI 200) as detailed above (a) and after defined times at 37°C the trypsinized cells were lysed and probed for HBV envelope and core proteins by western blot and images quantified by densitometry. A summary of internalisation kinetics is depicted as the amount of intracellular HBV DNA, core or envelope proteins and plotted as relative data where the highest value of the respective parameter is set to 100%. Data are representative of up to three independent experiments presented as mean ± SEM. Each experiment consisted of three replicates per condition. Statistical analysis was performed using a Mann-Whitney U test (*p < .05, **p < .01, ***p < .001), n.d: not detected

