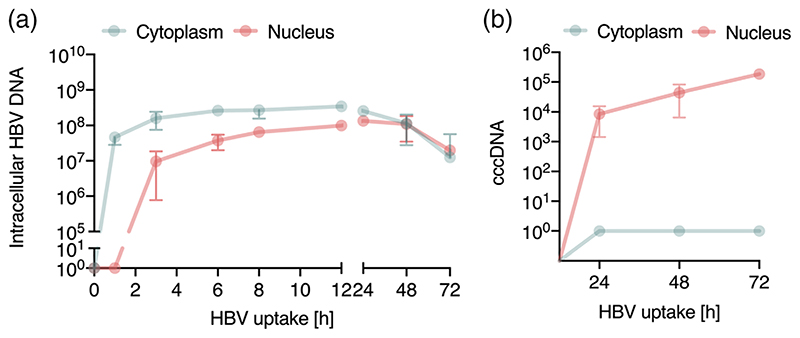
Figure 5. Kinetics of HBV trafficking to the nucleus.
(a) Intracellular HBV trafficking in cytoplasm and nucleus. Synchronised HBV infection (MOI 200) where cytoplasmic and nuclear samples were harvested at the indicated times. HBV DNA was first detected in cytoplasm at 1 h and in the nucleus after 3 h and monitored thereafter. Detection threshold of the qPCR lies between 10-100 copies. (b) Synchronised infection and cccDNA levels. HepG2-NTCP K7 cells were inoculated with HBV (MOI 200) as detailed above (a) and cccDNA levels in the cytoplasmic and nuclear fraction measured. Absolute numbers of total intracellular HBV DNA and cccDNA in cells/cm2 are shown. Data are representative of two independent experiments presented as mean ± SEM. Each experiment consisted of duplicates per condition. Statistical analysis was performed using a Mann-Whitney U test (*p < .05, **p < .01, ***p < .001)

