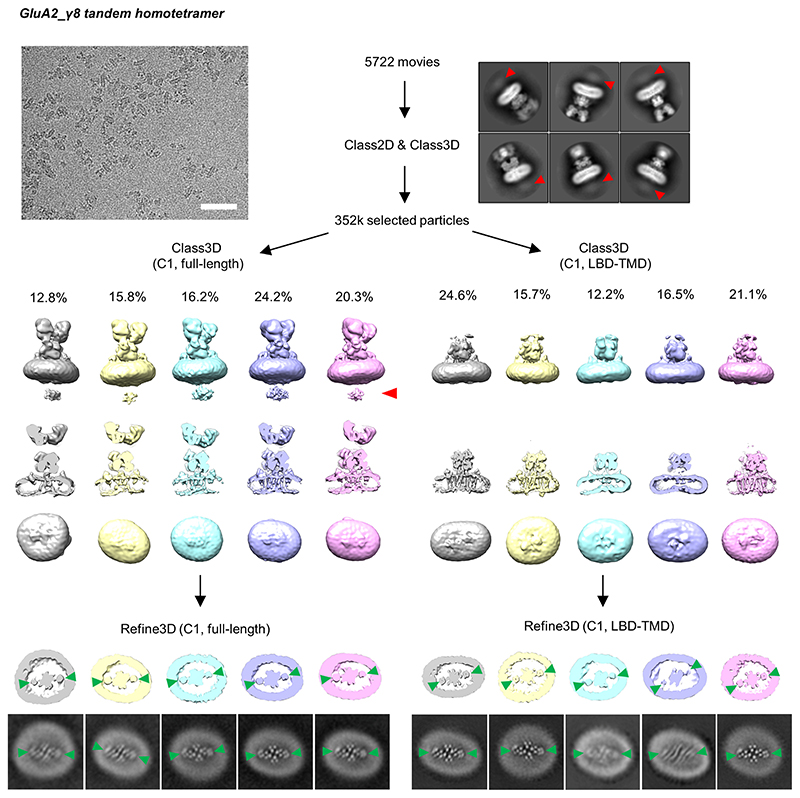
Extended Data Figure 6. Cryo-EM data processing workflow of GluA2_γ8 homomeric complex.
Automatic particle picking was first applied on the raw images which had similar features to the A1/A2_γ8/C2 heteromeric complex (scale bar, 50nm). 2D classifications were then performed to remove particles lacking AMPAR features. In several side view 2D class averages, an additional layer of density (marked by a red arrowhead) beneath the micelle can be observed. Next, selected particles were used for separate 3D classifications on the full-length receptor (left panel) or on masked-out LBD-TMD regions (right panels). In each of the two classifications, ~10% of low-quality particles were removed and the remaining AMPAR-shaped class averages are presented (side- and bottom views). An additional layer was observed in the full-length classification (indicated by red arrow). 3D refinement was performed on all classes individually, slices of the TMD region from the refined maps are also shown, with γ8 densities only apparent at the B’D’ sites (indicated by green arrowheads).

