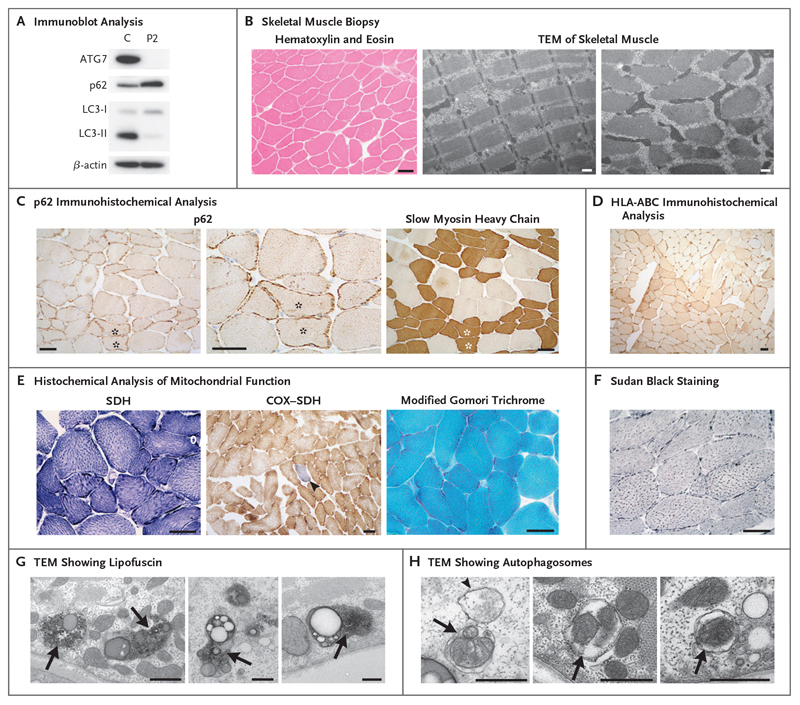
Figure 3. Mild Myopathic Changes in ATG7-Deficient Human Skeletal Muscle.
Panel A shows immunoblot analysis of steady-state levels of autophagy proteins ATG7, p62, and LC3 in myoblasts from Patient 2 relative to a control (C) cell line; results reflect one analysis each. Panel B shows hematoxylin and eosin staining and transmission electron microscopy (TEM) indicated that no vacuoles or internalized nuclei were present and that the organization of skeletal muscle fibers was normal. Panel C shows immunohistochemical analysis with an antibody reactive to p62, which showed abnormal aggregation of p62 within the subsarcolemmal region of muscle. An accentuation of these accumulations within slow myosin heavy chain-positive (type I) muscle fibers can be seen in serial sections (highlighted with asterisks). Panel D shows immunohistochemical analysis with antibodies against the inflammatory markers HLA-A, -B, and -C (HLA-ABC). Panel E shows histochemical reactions for mitochondrial succinate dehydrogenase (SDH) and sequential cytochrome c oxidase (COX)-SDH activity; the blue fiber (arrowhead) is COX-deficient. Modified Gomori trichrome staining showed no evidence of abnormal mitochondrial subsarcolemmal accumulation. Panel F shows Sudan black (neutral lipid) staining, which was slightly accentuated. Panels G and H show transmission electron micrographs in which an accumulation of lipofuscin (Panel G, arrows) and the presence of autophagosomes engulfing mitochondria (Panel H, arrows) and general cytoplasmic constituents (Panel H, arrowhead) can be seen. Scale bars indicate 50 μm (immunohistochemical analyses in Panels B through F) and 500 nm (TEM in Panels B, G, and H).

