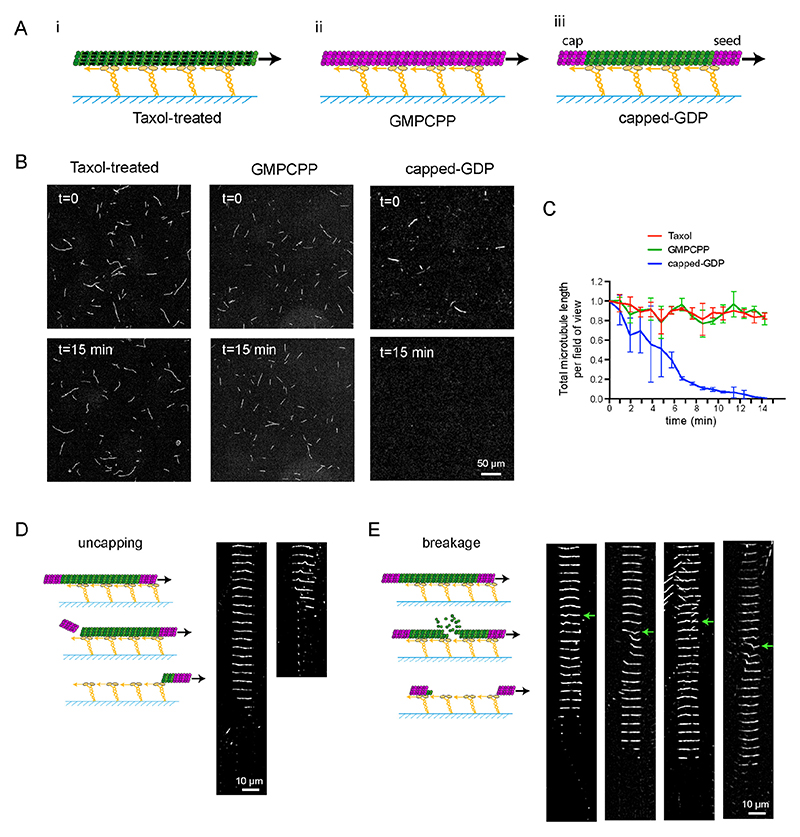
Figure 1. Gliding assays destroy non-stabilized microtubules.
A - Schematic representation of the different types of microtubules used in gliding assays. Taxol-treated (purple) (i) and GMPCPP-microtubules (magenta dimers) (ii) are stabilized along their length. Capped-GDP microtubules (iii) are stabilized at their ends (magenta dimers) but the central part (green dimers) is not. Molecular motors (yellow) are attached to the cover glass (blue), and propel microtubules along the glass surface in the presence of ATP.
B - Images of gliding microtubules when motors are activated by the addition of ATP (t=0, top row) and 15 minutes later (t=15 min, bottom row) in the three conditions described in A. Scale bar: 50 μm.
C - Quantification of microtubule length variations in the experiments shown in B. The microtubule lengths were measured for all microtubules in the 600-μm-wide fields every minute during 15 minutes. Values were normalized with respect to the initial length (Number of independent experiments N=2, Taxol-treated microtubules n=55; GMPCPP-microtubules n=42; capped-GDP microtubules n=42). Error bars represent standard deviation.
D - Schematic representation of microtubule disassembly induced by the loss of the cap. Two examples of microtubules that disassembled from an end during the gliding assay are shown. Images are vertical montages from a movie where images were acquired every 5 s. Scale bar: 10 μm.
E - Schematic representation of microtubule disassembly induced by breakage of the central region of the microtubule. Four examples of microtubules that break and disassemble during the gliding assay are shown. Images are vertical montages from a movie where images acquired every 5 sec. Green arrows point to bending events that precede the weakening and eventual breakage of the microtubule. Scale bar: 10 μm.

