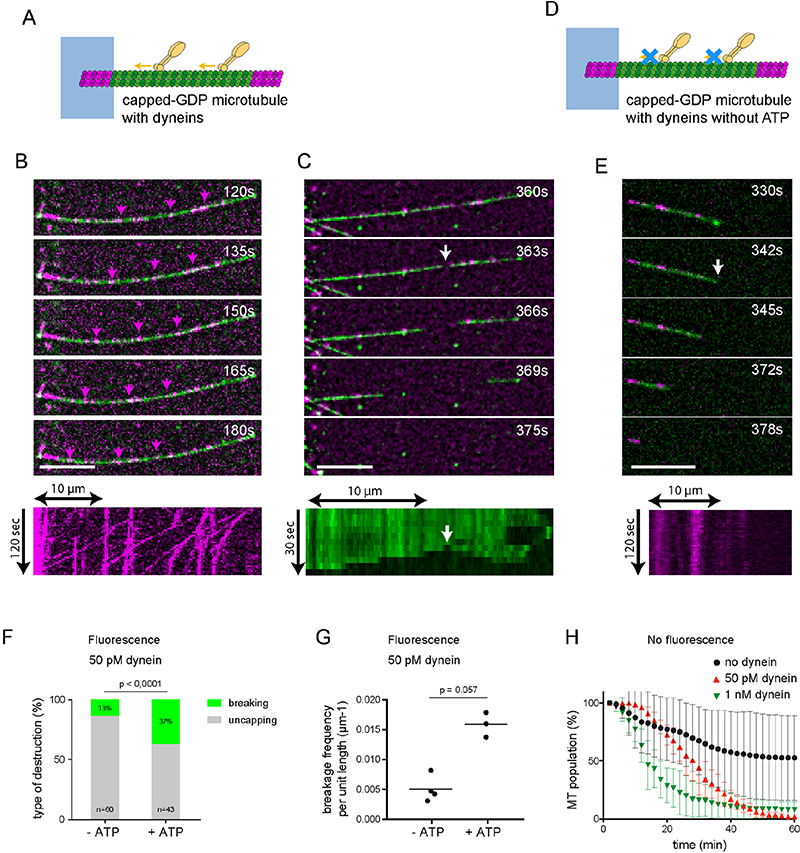
Figure 3. Single dyneins can damage the microtubule lattice.
A - Schematic representation of the motility assay with dyneins. The microtubule seed (magenta) is attached to the micropattern (blue), while the shaft (green) and the cap (magenta) are free. Molecular motors (dyneins, yellow) walk along the microtubules toward microtubule minus-end in the presence of ATP.
B - Image sequence showing single dyneins (magenta, 50 pM) walking along a micropatterned capped microtubule (green). The magenta arrows track moving dyneins. Images were taken every 3 sec. Scale bar: 10 μm. The kymograph shows the traces of single dyneins (50 pM) moving toward microtubule minus-end on the micropattern.
C- Image sequence illustrating lattice breakage (white arrow). Scale bar: 10 μm. The kymograph below shows the microtubule shaft and its disassembly toward both ends from the breaking point.
D - Same schematic representation than in A. Molecular motors (yellow) do not walk along the microtubules in the absence of ATP.
E - Image sequence showing single dyneins (magenta) binding to a micropatterned capped microtubule (green). The white arrow points at the loss of the GMPCPP cap that is followed by microtubule disassembly. The kymograph below shows the traces of single dyneins that are not moving on the microtubule. Scale bar: 10 μm.
F - Bar graph showing the relative proportion of microtubule disassembly after the loss of their cap (grey) or a breakage in their central part (green) in response to dynein (50 pM) depending on the presence or absence of ATP. With ATP, N=3 independent experiments and 43 microtubules in total, without ATP, N=4 independent experiments and 60 microtubules. The p value was measured with a Fisher exact test.
G - Graph showing the spatial frequency of microtubule breakage in response to dynein (50 pM) depending on the presence or absence of ATP. With ATP, N=3 independent experiments for a total length of 1298 μm. Without ATP, N=4 independent experiments for a total length of 1750 μm. The p value was measured with a Fisher exact test.
H - Survival curve of microtubules in the absence (black circle) or presence of dyneins at 50 pM (red triangle) or 1 nM (green triangle). Dyneins were not labelled and capped-microtubules were not labelled. Data were acquired with RICM, ie in the absence of fluorescence, and in the presence of glycerol. Number of independent experiments: no Dynein, N=9, n=371; 50 pM Dynein, N=2, n=211; 1 nM Dynein, N=2, n=152. Statistical test: see Supplementary figure 2. Error bars represent standard deviation.

