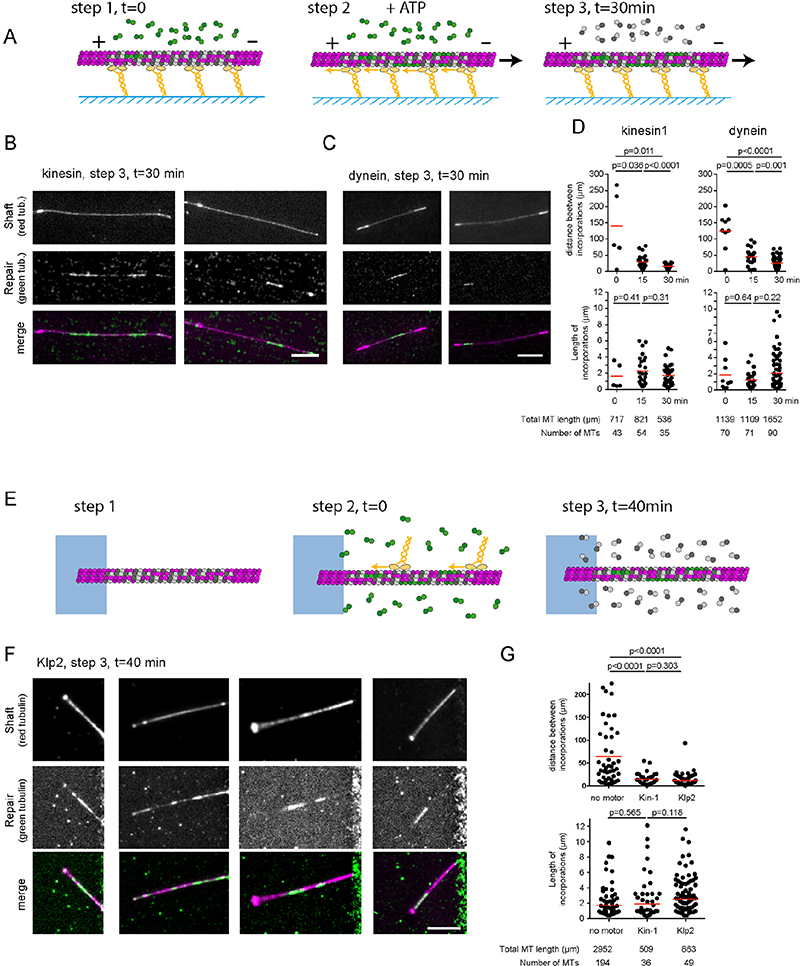
Figure 5. Molecular motors enhance tubulin exchange in the microtubule lattice.
A - Schematic representation of the three sequences during gliding assays of capped-GDP microtubules in the presence of 14μM of free fluorescent tubulin. All experiments lasted 30 minutes. Only the duration of the gliding step was varied. Step1 corresponds to the loading of capped-GDP microtubules and free green tubulin dimers on the layer of motors. Step 2 corresponds to the initiation of gliding by the addition of ATP. In the 0-minute condition, ie without gliding, step 2 was skipped and ATP was not added. In the 15-minute condition, step 2 was initiated 15 minutes after step 1. In the 30-minute condition, step 2 immediately followed step 1. In all cases, fluorescent tubulin were removed after 30 minutes to measure the incorporation of free tubulin.
B, C – Images show the microtubule shaft (low intensity) with associated cap and seed (high intensity) (top row), the incorporation of free tubulin (middle row), and the overlay of the two signals (bottom row) at the end of the gliding assay (step 3). In these examples, microtubules glided on kinesin-1 (B) or dynein (C) for 30 minutes. Scale bar: 10 μm.
D – Quantifications of the spatial frequency (top) and size (bottom) of the incorporation sites upon gliding on kinesin-1 (left) or dynein (right) depending on the duration of the gliding step. Data were acquired during two independent experiments. Each experiment allowed the measurement of a single value of incorporation frequency over several microtubules. Red bars show geometrical means with 95% confidence interval. P-values were obtained using a non-parametric Mann-Whitney test. The table indicates the number and total length of microtubules that were measured in each condition.
E - Schematic representation of the three sequences during motility assays on capped-GDP microtubules in the presence of 14μM of fluorescent tubulin. Step 1 is the growth and capping of microtubules. Step 2 corresponds to the addition of motors and fluorescent tubulin. Step 3 corresponds to the removal of motors and replacement of fluorescent tubulin by non-labelled tubulin 40 minutes later.
F - Images show the microtubule shaft (top row), the incorporation of free dimers (middle row), and the overlay of the two signals (bottom row) at the end of the motility assay. Scale bar: 10 μm.
G - Quantification of the spatial frequency (top) and size (bottom) of the incorporation sites following the motility of kinesin-1 (10 nM) or Klp2 (10 nM). Data were acquired during four independent experiments for the control conditions without motors, a single experiment with kinesin-1 and two independent experiments with Klp2. Each experiment allowed the measurement of a single value of incorporation frequency over several microtubules. Red bars show geometrical means with 95% confidence interval. P-values were obtained using a non-parametric Mann-Whitney test. The table indicates the number and total length of microtubules that were measured in each condition.

