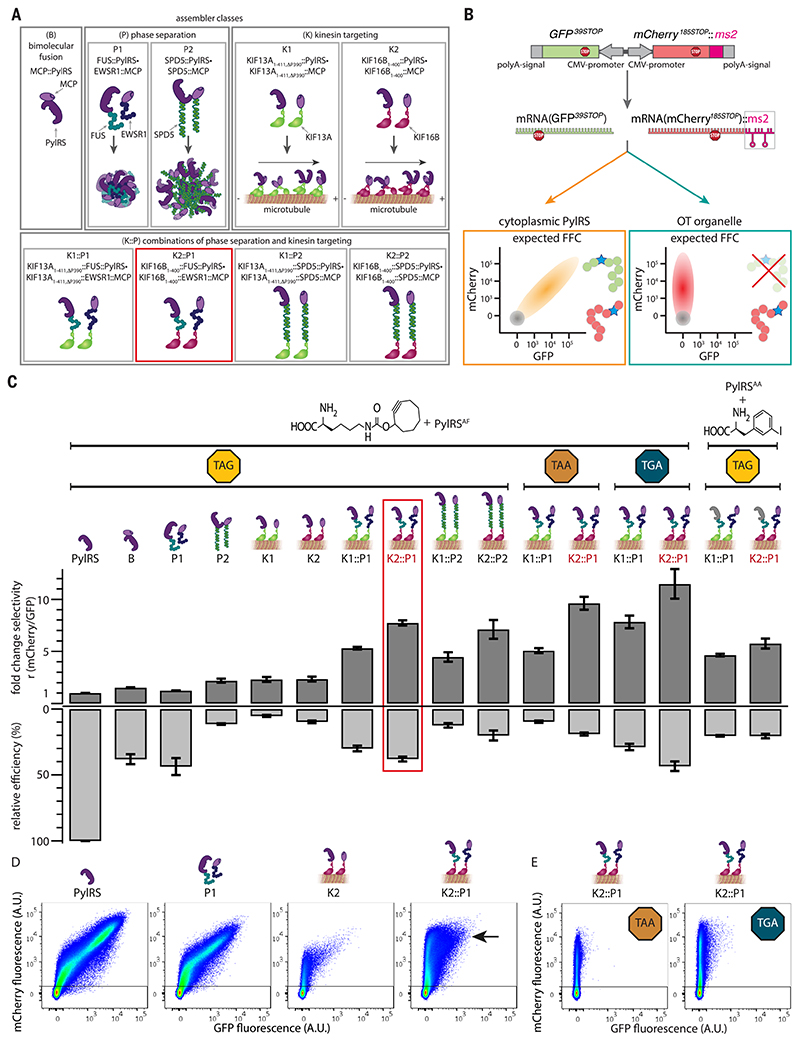
Fig. 2. Local enrichment by means of phase separation is a means to generate OT organelles.
(A) Schematic representation of different assembler classes. B, bimolecular MCP::PylRS fusion; P1, fusions to FUS and EWSR1; P2, SPD5; K1, truncation of kinesin KIF13A (KIF13A1-411,ΔP390); K2, truncation of kinesin KIF16B (KIF16B1-400) and combinations thereof (K1::P1, K1::P2, K2::P1, and K2::P2). (B) Schematic representation of the dual-color reporter. mRNAs encoding the fluorescent proteins GFP and mCherry, containing stop codons at permissive sites, are expressed from one plasmid, each with its own CMV promoter, ensuring a constant ratio of mRNA throughout each experiment. The mRNA of the mCherry reporter is tagged with two ms2 stem loops, mCherry:: ms2. In the presence of ncAA and tRNAPyl, in the case of cytoplasmic PylRS, both GFP39STOP and mCherry185STOP are produced, leading to a diagonal (schematically drawn in orange) in FFC analysis. However, under the same conditions, orthogonal translation in OTorganelles should enable selective stop codon suppression of mCherry::ms2 mRNA, resulting in an mCherry-positive and GFP-negative population (drawn schematically as a red vertical population). In both schemes, nontransfected HEK293T cells, which are also detected with FFC, are represented by a gray circle. (C) For all experiments, the indicated constructs were coexpressed with tRNAPyl (anticodon corresponding to the indicated codon) and the dual reporter (GFP39STOP, mCherry185STOP::ms2). GCE was performed in presence of the indicated ncAAs, and cells were analyzed by means of FFC. The dark gray bars (normalized to cytoplasmic PylRS) represent the fold change in the ratios r of the mean fluorescence intensities of mCherry versus GFP (derived from FFC) (Fig. 2, D and E, and fig. S1) for all the systems tested in this study. The light gray bars represent the relative efficiency as defined by the mean fluorescence intensity of mCherry for each condition divided by cytoplasmic PylRS control (derived from FFC) (Fig. 2, D and E, and fig. S1). Shown are the mean values of at least three independent experiments; error bars represent the SEM.The red box highlights the best performing OTorganelle (OTK2::P1). (D) FFC analysis of the dual-color reporter expressed with the four indicated systems in transfected HEK293Tcells and tRNAPyl in the presence of the ncAA SCO, a lysine derivative with a cyclooctyne side chain. Highly selective and efficient orthogonal translation was observed for the OT organelle (the black arrow indicates a bright, highly mCherry-positive population). Shown in the dot plots are the sums of at least three independent experiments. Axes indicate fluorescence intensity in arbitrary units (all FFC plots are summarized in fig. S1). (E) FFC plots for the OTorganelle selectively translating Opal and Ochre codons only of recruited mCherry185TGA::ms2 and mCherry185TAA::ms2 mRNA, respectively (corresponding cytoplasmic PylRS controls for those stop codons are provided in fig. S1).

