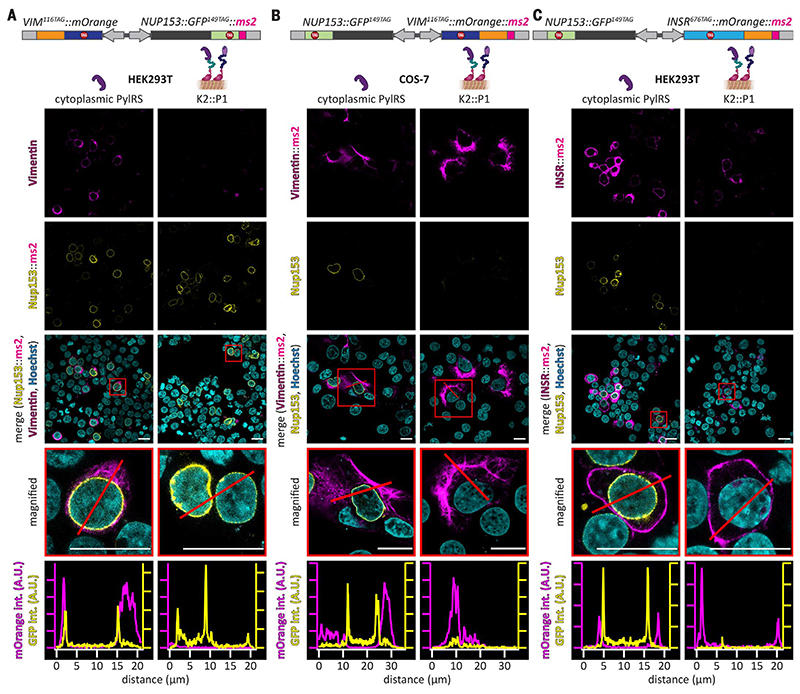
Fig. 3. A versatile OT organelle for selective and efficient orthogonal translation.
(A to C) Confocal images of cells transfected with constructs encoding PylRS (left column) or the OTK2::P1 organelle (right column) for different protein pairs. SCO and tRNAPyl were present in all cases. (A) HEK293T cells were transfected with NUP153::GFP149TAG::ms2 and VIM116TAG::mOrange. (B) VIM116TAG::mOrange::ms2 and NUP153::GFP149TAG transfected in COS-7 cells. More representative examples for (A) using COS-7 cells and for (B) using HEK293T cells are shown in fig. S5. Shown from top to bottom are Vimentin116TAG::mOrange (magenta, characteristic cytoskeletal stain), Nup153::GFP149TAG (yellow, characteristic nuclear envelope stain), overlay with Hoechst (cyan, nuclear stain), magnified images of representative cells (red boxes), and line profiles for the mOrange and GFP channel (red line, magenta and yellow curves, respectively), to highlight that only the ms2-tagged mRNA yields its respective expressed protein if the OTK2::P1 organelle is present. Scale bars, 20 mm. (C) HEK293T cells were transfected with INSR676TAG::mOrange::ms2 and NUP153::GFP149TAG. Shown from top to bottom are INSR676TAG::mOrange (magenta, characteristic plasma membrane stain), Nup153::GFP149TAG (yellow), overlay with Hoechst (cyan), magnified images of representative cells (red boxes), and line profiles for the mOrange and GFP channel (red line, magenta and yellow profiles, respectively), demonstrating selective translation of insr676TAG::mOrange::ms2 mRNA by the OTK2::P1 organelle. Scale bars, 20 μm.

