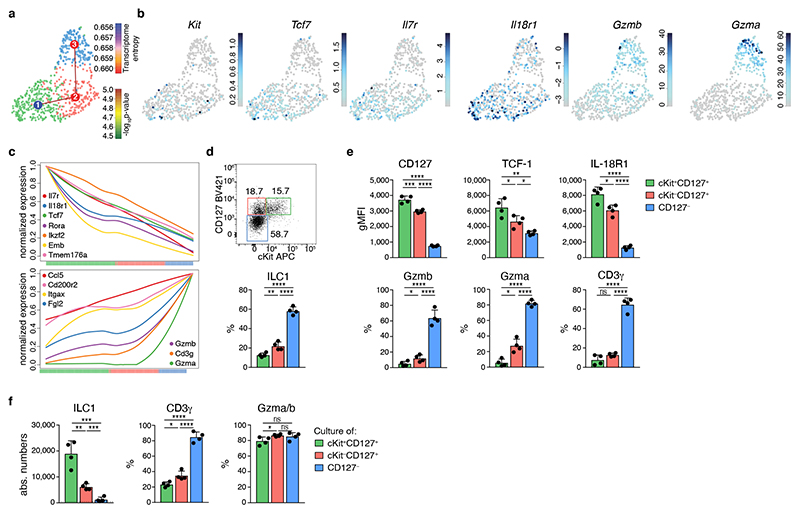
Fig. 3. TCF-1hi early ILC1s give rise to downstream effector ILC1s.
a-c scRNA-seq analysis of hepatic ILC1. a UMAP visualization of single-cell liver ILC1 transcriptomes clustered with RaceID3 and overlaid with lineage inference using StemID2. Node color depicts transcriptome entropy and link color indicates p-value of StemID2 links (p < 0.05, Methods). b UMAP visualization showing log2 normalized expression of selected genes. c Pseudo-temporal gene expression profile of indicated marker genes of Tcf7 hi (left) and Tcf7 lo ILC1 (right) along the inferred differentiation. Color bars indicate cluster identity. d, e Representative FACS analysis of hepatic ILC1 subsets based on CD127 and cKit expression. Histogram indicates the relative abundance within liver ILC1 (d). gMFI of CD127, TCF-1 and IL-18R1 expression within ILC1 subsets (top) and frequency of Gzmb, Gzma and CD3γ-positive cells within indicated ILC1 subsets (bottom) (e). f In vitro culture of sort-purified indicated hepatic ILC1 subsets cultured in the presence of IL-2 and OP9-DL1 cells for 7 days. Absolute numbers and frequency of CD3γ+ and Gzma+Gzmb+ cells on d7 is shown. Dashed line indicates number of cells on d0 (input=400 cells). Data are representative of 3 independent experiments (d-f) with n=3 mice per group (d, e) or n=4 replicates per experiment (f). Bar graphs indicate individual mice (d,e) or replicates (f) (symbols) and mean (bar), error bars display means ± SD. Statistical significance was calculated by unpaired two-tailed t-test; *p < 0.05, **p < 0.01, ***p < 0.001, ****p < 0.0001, ns – not significant.

