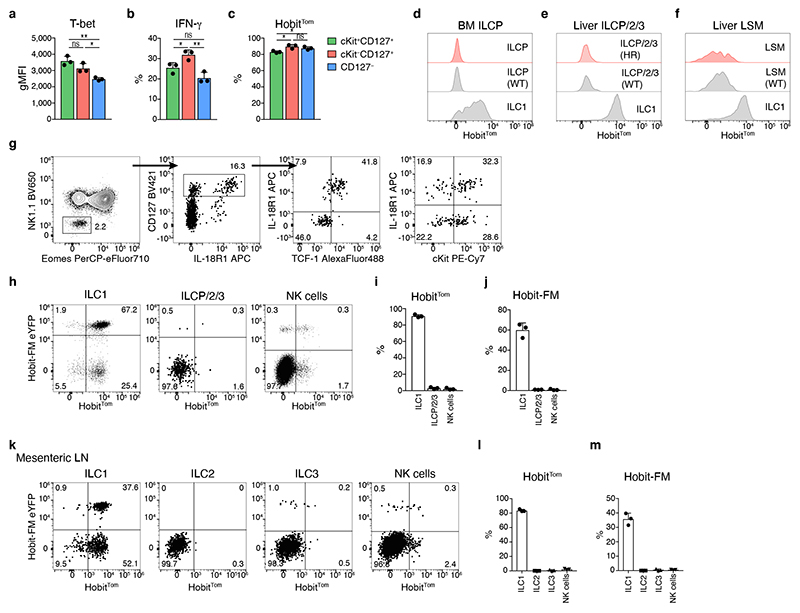
Fig. 4. Hobit marks lineage-committed ILC1s.
a gMFI of T-bet expression within subsets of hepatic ILC1. b Frequency of IFN-γ-producing cells within indicated subsets 4h after in vitro stimulation with IL-12/IL-18 and Brefeldin A. c Frequency of Hobit-positive ILC1 within indicated subsets. d-f Representative histograms showing expression of HobitTom indicated cell types in bone marrow (BM) and livers of WT and HobitTom/WT mice. BM ILCP were gated as Lin−NK1.1−CD127+IL-18R1+ST2− cells. BM ILC1 were gated as Lin−NK1.1+NKp46+CD49a+CD49b− cells. Liver ILCP/2/3 were gated as in (g). Liver LSM were gated as Lin−NK1.1−NKp46−CD11b+Sca1+ cells. g Gating strategy identifying and phenotyping Lin−NK1.1− CD127+ liver ILCP/2/3. h-m Representative FACS analysis of HobitTom and HobiteYFP fatemap (FM) labeling across different ILC lineages in the liver (h-j) and mesenteric LN (k-m). ILC2 were gated as Lin−NK1.1−NKp46−CD127+KLRG1+. ILC3 were gated as Lin− NK1.1−NKp46−CD127+KLRG1−CD90+ cells. Data are representative of 3 (a, c, e, g) or 2 (b, d, f, h-m) independent experiments with n=3 mice per experiment. Bar graphs indicate individual mice (symbols) and mean (bar), error bars display means ± SD. Statistical significance was calculated by unpaired two-tailed t-test; *p < 0.05, **p < 0.01, ns – not significant.

