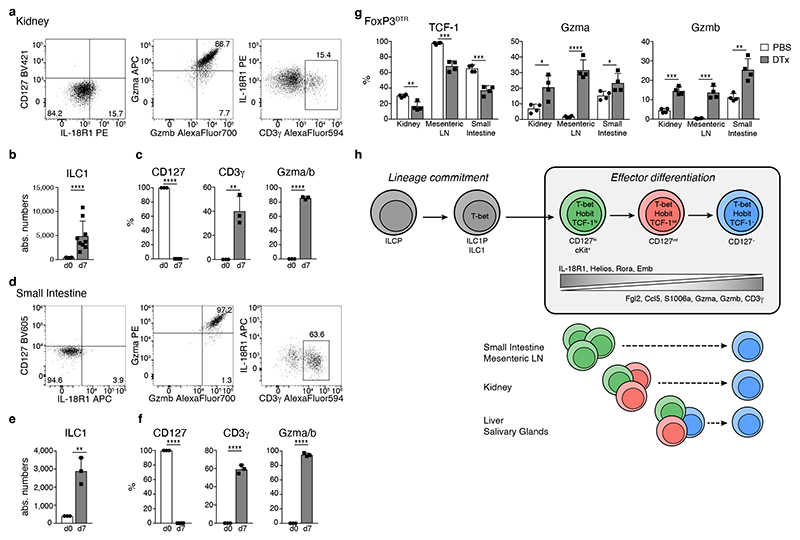
Fig. 8. The developmental potential of ILC1s is conserved across tissues.
a-fIn vitro culture of CD127+ kidney (a-c) and small intestinal (d-f) ILC1 in the presence of IL-2 and OP9-DL1 feeder cells. a, d Representative FACS plots on d7. b, e Absolute numbers of cells on d0 (input=400 cells) and d7. c, f Frequency of CD127+, CD3γ+ and Gzma+Gzmb+ cells. Data representative of 3 independent experiments with n=3 replicates per experiment. g FACS analysis of ILC1s from indicated organs of Treg depleted or mock treated FoxP3DTR mice on d8 of DT treatment (DTx). Histograms indicate the frequency of ILC1s expressing indicated proteins is depicted. Data are representative of 3 independent experiments with n=4 mice per group. h Schematic summarizing sequential mechanisms of ILC1 lineage commitment and effector differentiation downstream of TCF-1hi “early” ILC1s, which is transcriptionally regulated by Hobit. ILC1s across tissues have a uniform capacity to differentiate towards TCF-1lo Gzmhi cells. Bar graphs indicate replicates (b, c, e, f) or individual mice (g) (symbols) and mean (bar), error bars display means ± SD. Statistical significance was calculated by unpaired two-tailed t-test; *p < 0.05, **p < 0.01, ***p < 0.001, ****p < 0.0001.

