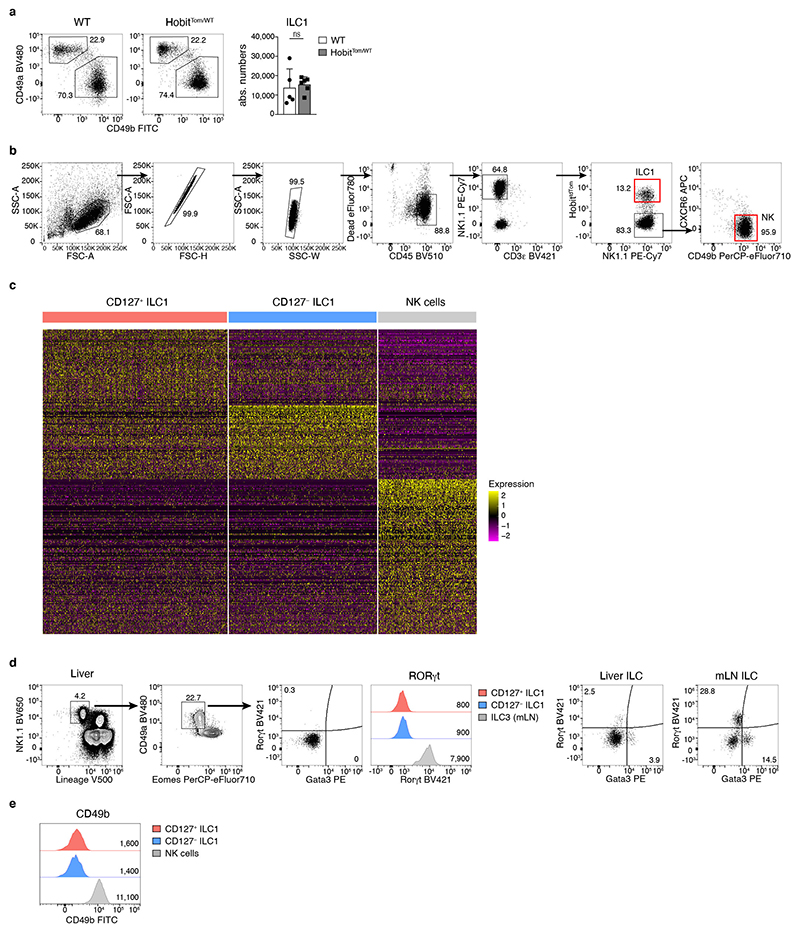
Extended Data Fig. 1. Characterization of hepatic group 1 ILCs and gating strategy.
a Representative FACS plots display Lin−NK1.1+ cells of WT and HobitTom/WT mice. Bar graphs indicate absolute numbers of liver ILC1. Data are pooled from 2 independent experiments with n=2 and 3 mice per group. b Full sorting strategy for liver ILC1 and NK cells from negatively enriched liver lymphocytes of HobitTom/WT mice. c Heat map overview of significantly differentially expressed genes of ILC1 and NK cell clusters from Fig. 1c using Seurat. d, e Gating strategy to identify Lin− NK1.1+ Eomes− CD49a+ liver ILC1 and histograms showing Gata3, RORγt (d) and CD49b (e) protein expression within liver ILC1. Mesenteric lymph node are gated on Lin− CD127+ cells to display Gata3 and RORyt expression. Data are representative of 2 individual experiments with n=3 mice. Bar graphs indicate individual mice (symbols) and mean (bar), error bars display means ± SD. Statistical significance was calculated by unpaired two-tailed t-test; ns – not significant.

