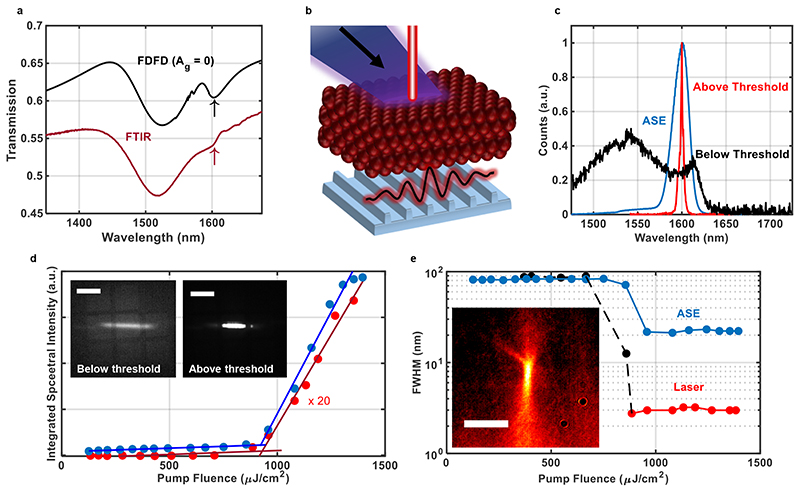
Fig. 2. DFB lasing characterisation.
(a) Transmission spectra simulated using FDFD solver (black) along with that measured via FTIR from the DFB laser sample (red). (b) Diagram showing DFB lasing from CQDs when optically pumped. (c) Spectra collected out-of-plane, perpendicular to the sample surface, below lasing threshold (black) collected using low-resolution settings, and above threshold (red), collected using high resolution settings. The ASE spectra (blue) is also plotted was collected in-plane from the side of the sample. (d) Integrated spectra plotted against pump fluence, used to determine threshold behaviour. Insets show the infrared image of take from the surface of the sample below and above lasing threshold as indicated (scale bar 1 mm). (e) The FWHM of collected lasing and ASE emission spectra plotted as a function of optical pump fluence. Black and red points indicate FWHM obtained from low and high resolution spectra respectively. Inset shows a false-colour infrared beam profile taken 2 cm away from the surface of the sample (scale bar 1 mm).

