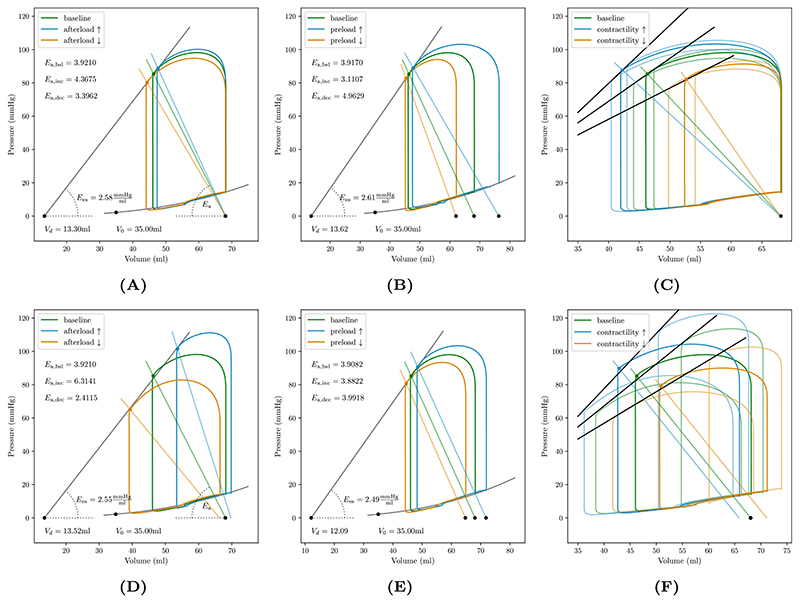
Figure 7.
Left ventricular pV loops showing the initial response (A–C) and 4 cycles (D–F) after applying a step change in loading conditions and contractility. (A) Altering afterload by increasing/decreasing the systemic vascular resistance, R sys pivots arterial elastance E a curve. Endsystolic elastance, E es and intercept V d characterizing the ESPVR was determined by linear regression of end-systolic data points V es and p es, marked by solid circles. (B) Increasing/decreasing preload shifts E a curve and increases/decreases stroke volume via the Starling mechanism, mediated by the length-dependence of the active stress model. Determination of ESPVR was consistent with afterload protocol. (C) Increasing/decreasing contractility increases/decreases stroke volume, LV peak pressure and p es. For each contractile state afterload was also perturbed to determine end-systolic elastance E es and V d.

