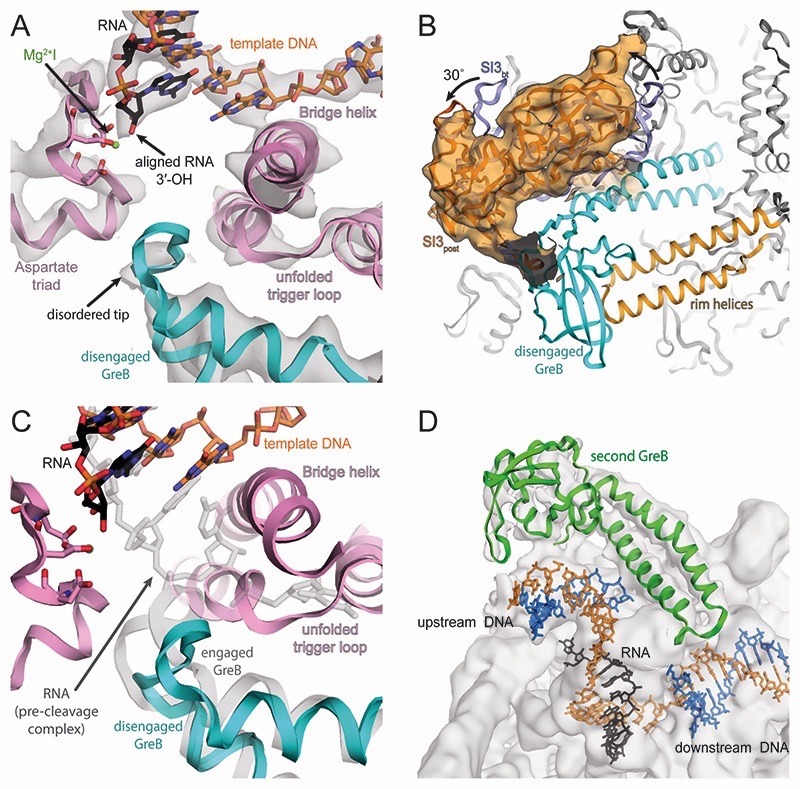
Figure 4. Active site of post-cleavage complex and additional GreB binding.
(A) Density for the active site (grey transparent surface) reveals the RNA in a post-translocated register (black), the template DNA (orange) as well as RNAP components (pink). Density for MgI (green) is weak but visible at lower contour level. The tip of GreB (cyan) is more disordered than in the pre-cleavage complex. (B) Similar to the pre-cleavage complex, a low-pass filtered map confirms SI3 rotates relative to the backtracked state as a result of GreB binding. (C) Superposition of pre- (grey transparent) and post-cleavage (colored) complex indicates that GreB disengages from the active site as a result of RNA cleavage. (D) 3D classification indicates a population of RNAP that bound a second copy of GreB (green) close to the upstream DNA, which becomes apparent at low contour level.

