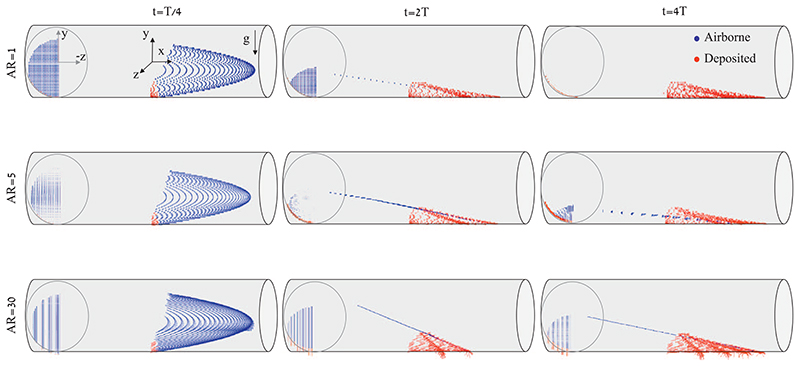
Fig. 2.
Time lapse sequence of particle locations under oscillatory shear flow shown at representative Re = 0.3 and Wo = 0.16. Instantaneous positions of airborne (blue) and deposited (red) particles are shown at three representative time instants, i.e. t = T/4 (left column), 2T (mid column) and 4T (right column). Three representative values of AR are illustrated: AR = 1 (top row), 5 (mid row) and 30 (bottom row). Shown in each tube is a cross section of the y–z plane (see Fig. 1b). See SM Videos 1 for dynamic renderings of the resulting particle dynamics. (For interpretation of the references to color in this figure legend, the reader is referred to the web version of this article.)

