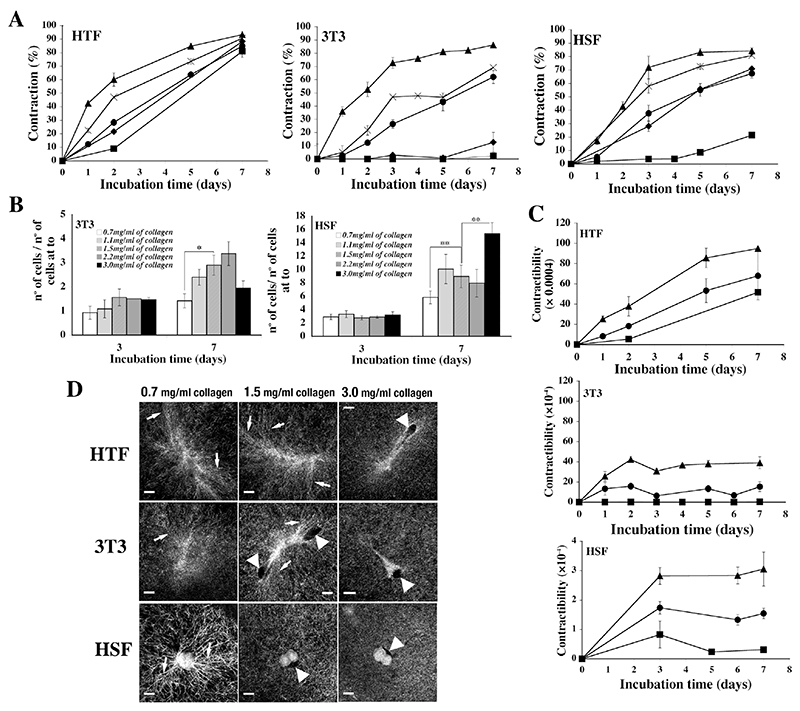
Figure 2. Collagen concentration modulates matrix contraction.
A) Fibroblast contraction profiles in gels with different collagen concentration (0.7 –triangles, 1.1 – crosses, 1.5 – circles, 2.2 - diamonds and 3.0 mg/ml of collagen, squares). Shown are means ± SEM from 2 (HTF5003), 5 (3T3) and 4 (HSF) sets of triplicate matrices. B) Cell proliferation in gels of different collagen concentration. Cells were counted after gel degradation at different time points during contraction and normalized to cell numbers at time 0, showing an increase in cell division in high collagen concentration. HTF did not divide in the gels at any concentration (not shown). Shown is mean ± SEM from 4 sets of triplicate matrices. Statistical significance: **, p < 0.001; *, p<0.05. C) Contractibility (contraction/cell) profiles in gels of different collagen concentration is inversely proportional to the collagen concentration. Shown are means and SEMs from 2 (HTF5003) and 4 (3T3 and HSF) sets of triplicate matrices. D) Cell-matrix interaction after 2 days in presence of 10% of serum in gels with different collagen concentrations visualized using reflection confocal microscopy. Low collagen concentration (0.7mg/ml) induces pericellular fibre alignment for HSF (arrows), while higher collagen concentration induces the formation of holes in the matrix around HTF fibroblasts (arrowheads) and decreases the ability of 3T3 and HTF to induce fibre alignment. Bars, 15 μm.

