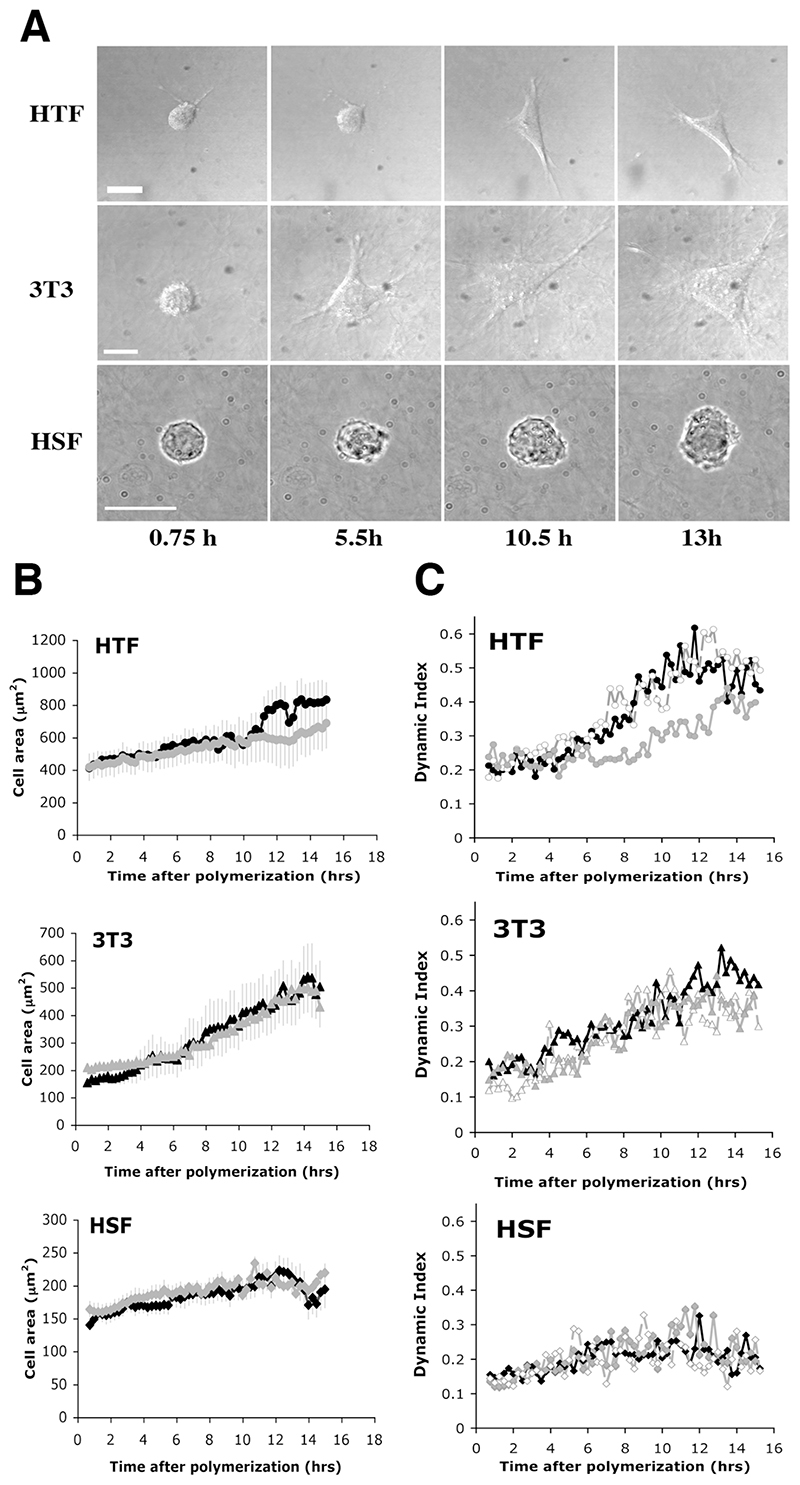
Figure 4. MMP inhibition affects cell dynamic behaviour.
Fibroblasts were seeded in gels (20000 cells/ml for 3T3 and HSF and 7500 cells/ml for HTF) in presence of 10% serum with (grey line) or without (black line) 100 μM GM6001, and cell behaviour was recorded for 15 hours, starting 30 min after gel polymerization. A) DIC (HTF, 3T3) and transmission (HSF) sequential images extracted from the 15 hrs time lapse (supporting movies 1a, 1b and 1c respectively) showing the cells’ activity in presence of 10% FBS. Time as indicated. Scale bars, 20μm. B) Early spreading in the matrix in the presence of GM6001. Cell area profile was calculated from the cell area measured on flat projections of phase contrast or DIC images. Show is the mean ± SEM for 7-9 cells for each curve. C) Effect of GM6001 on cell dynamic behaviour. Cell protrusive activity was quantified using the dynamic index in presence of 10% serum (black signs), 10% serum plus 100 μM GM6001 (grey signs) and 10% serum plus DMSO as solvent control (empty signs). Shown is the mean of 5-9 cells for each condition. SEM < 10%. Significant differences in the plateau reached for HTF (11 to 15 hours post-polymerisation, p < 0.0001).

