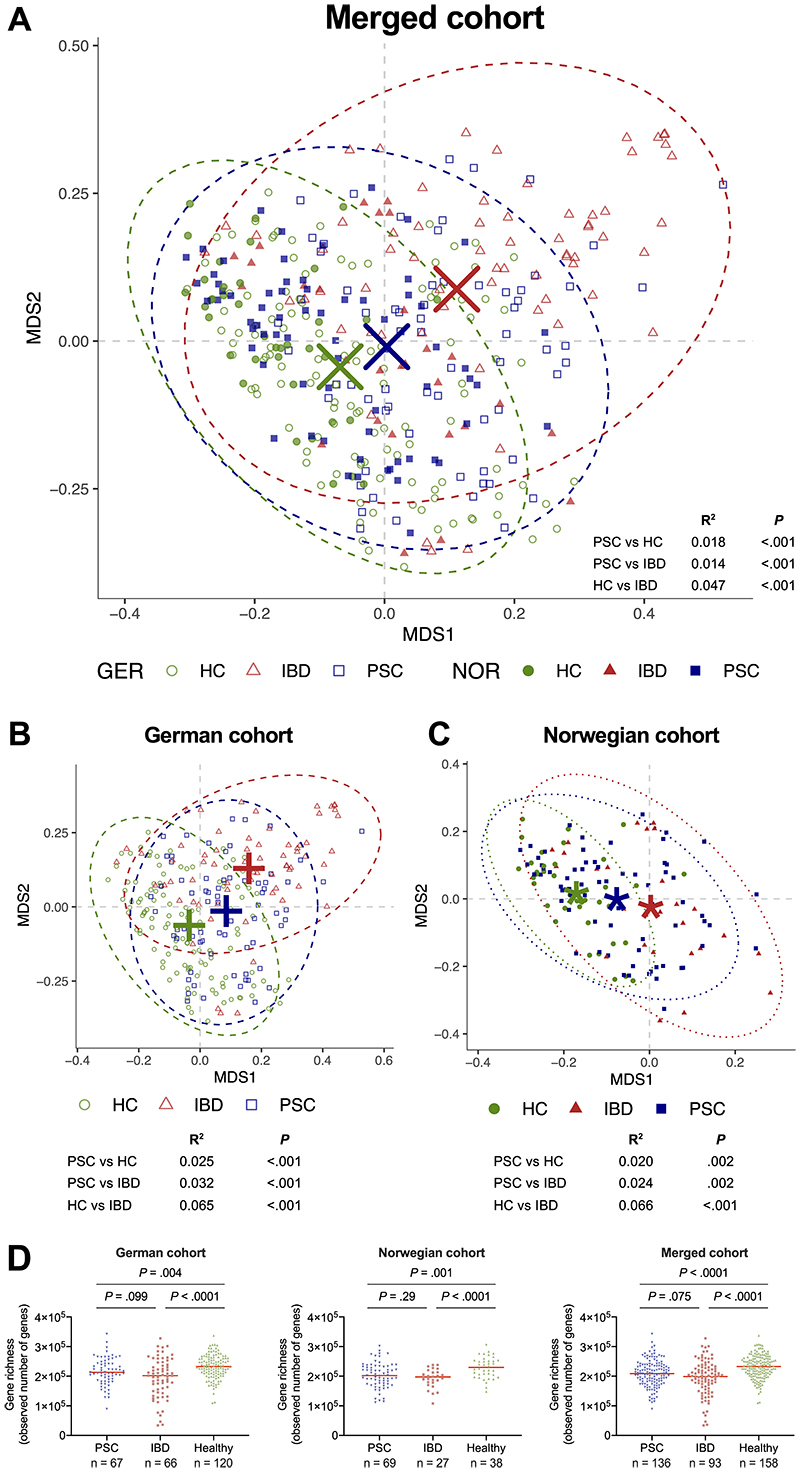
Figure 1. Overall bacterial taxonomic composition and gene richness in PSC patients and controls.
Non-constrained ordination of genus-level Bray-Curtis dissimilarities in the microbiome of (A) patients with PSC, as well as healthy and IBD controls, in the merged cohort, and in the (B) the German and (C) the Norwegian cohorts separately, showing shifts in the global microbiome composition. (D) Number of observed genes in PSC compared to controls. All group centroids in A-C represent the arithmetic mean of the groups' respective points in the ordination, ellipses represent 95% confidence level of the multivariate t-distributions. Red horizontal bar in D represents the median. GER, Germany; HC, healthy control; IBD, inflammatory bowel disease; NOR, Norway; MDS, multiple dimension scale; PSC, primary sclerosing cholangitis.

