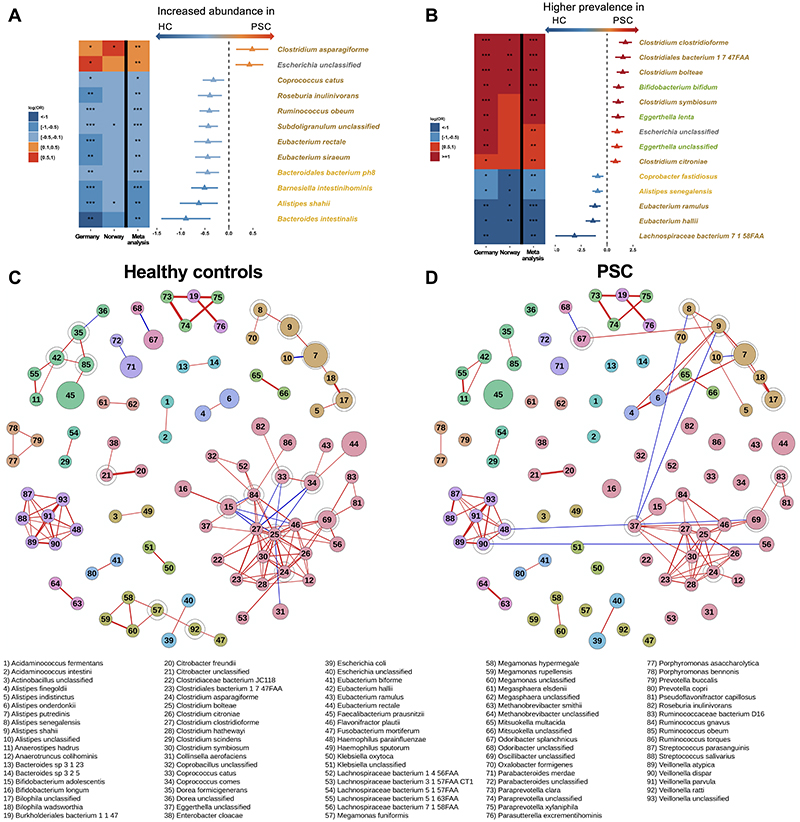
Figure 2. Differences in species composition in PSC compared to healthy controls.
(A) Species that were differently abundant and (B) species with different prevalence in PSC and healthy controls. Species are colored by phyla affiliation. (C) Bacterial abundance co-correlation network in healthy controls and (D) PSC patients. In A&B the triangle/bar in the forest plot indicate log(OR)/SE. Red and blue lines in C&D indicate positive and negative correlations between species, respectively. Node-size reflects the square-root transformed median relative abundances in each phenotype, and encircled nodes mark articulations points. Only correlations with r>0.4 are shown, and increasing correlation coefficient are reflected by increasing line thickness. PSC, primary sclerosing cholangitis; HC, healthy controls. *Q fdr<.05, ** Q fdr<.005, *** Q fdr<.0005.

