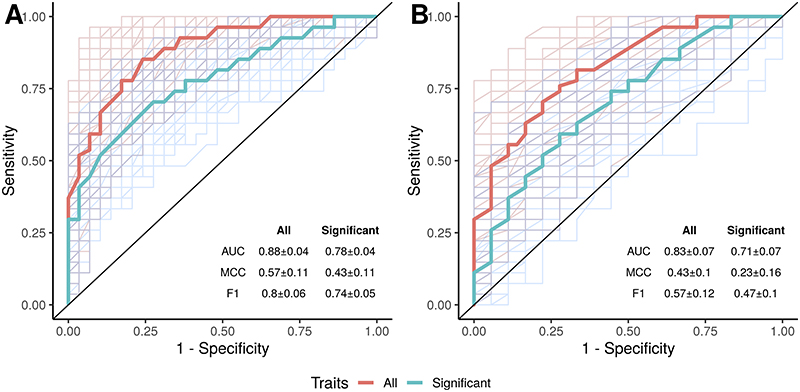
Figure 6. Separation of clinical phenotypes using random forest classification.
(A) PSC vs. healthy controls and (B) PSC vs. IBD. Results using all available species (red line) or only the significant species hits (blue line). AUC, area under the curve; F1, F1 measure; IBD, inflammatory bowel disease; MCC, Matthew’s correlation coefficient (range: -1– +1); PSC, primary sclerosing cholangitis.

