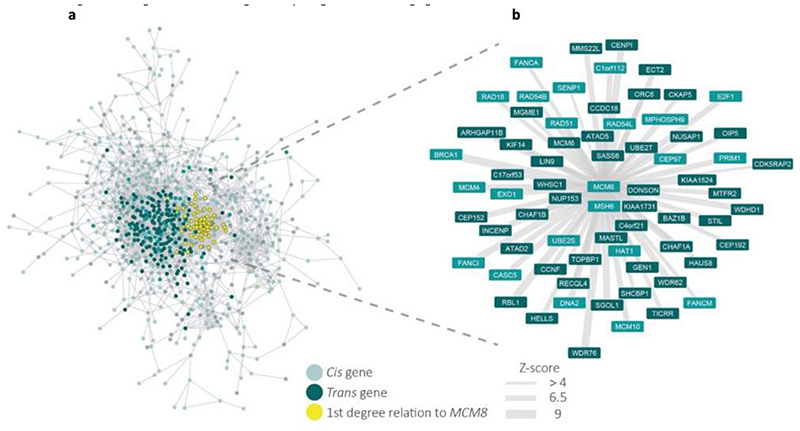
Extended Data Figure 5. Gene co-regulation networks for age at menopause genes with those co-regulated with MCM8 highlighted.
a, Gene co-regulation network for genes relating to age at menopause. Nodes indicate genes that either in a cis region from the GWAS or have been prioritized by Downstreamer, edges indicate a co-regulation relationship with a Z-score >4. Co-regulation is defined as the Pearson correlation between genes in a scaled eigenvector matrix derived from a multi-tissue gene network68. Cis genes are defined as genes that are within +/-300kb of a GWAS top hit for age at menopause. Trans genes are defined as having been prioritized by Downstreamer’s co-regulation analysis and are not within +/-300kb of a GWAS top hit. Downstreamer prioritizes genes by associating the gene p-value profile of the GWAS (calculated using PASCAL67) to the co-regulation profile of each protein coding gene. Only genes where this association passes Bonferroni significance are shown as trans genes. Colours of nodes indicate the following: Teal indicates Cis genes, Dark Teal indicates Trans genes and Yellow indicates genes with a 1st degree relation to MCM8. b, Gene co-regulation network showing the genes that have a first degree relationship with MCM8 with a Z-score >4. Width of the edge indicates the Z-score of the co-regulation relationship. Colours indicate the same as in a, with the exception of Yellow, as all genes indicated have a 1st degree relation to MCM8.

