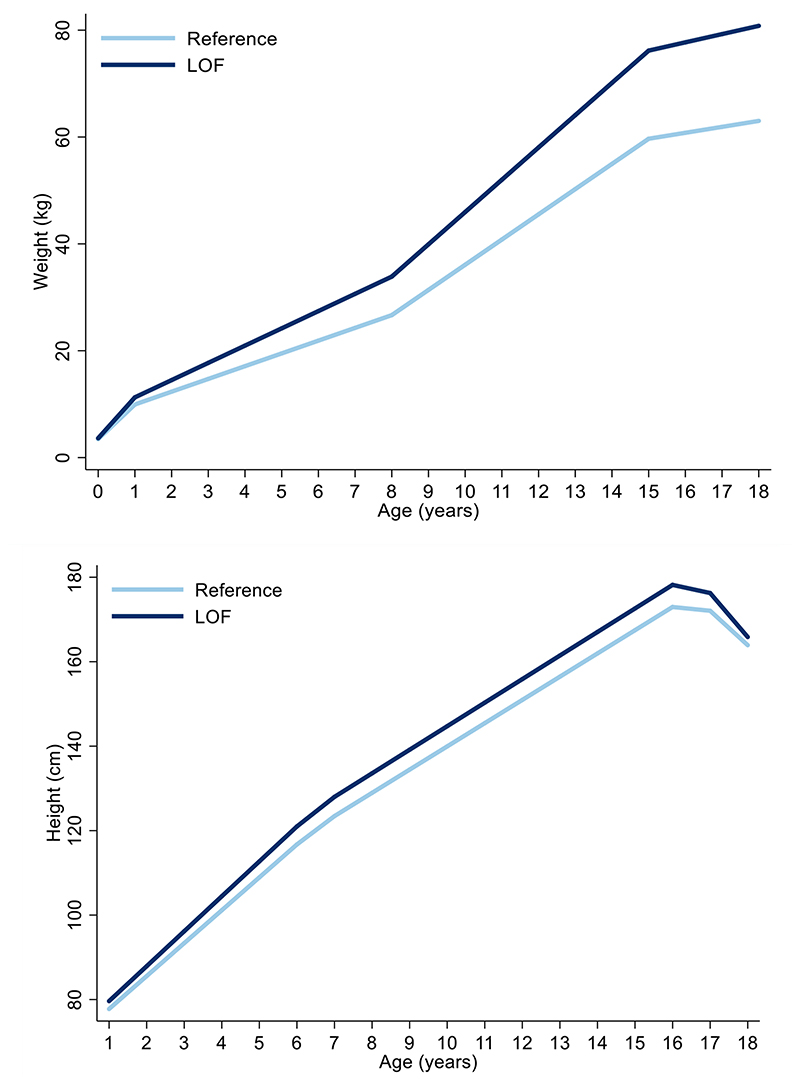
Extended Data Figure 7. Association between MC4R LoF of cAMP accumulation with weight and height trajectories between birth and 18 years using linear spline multi-level models.
Values for the reference group (i.e., all individuals with synonymous, common variations or no LoF mutations and individuals with WT-like and GoF mutations) and LoF mutations (i.e., combining pLoF and cLoF mutations) are depicted in light and dark blue, respectively (N=5716). Effect estimates and confidence intervals of these associations are presented in Supplementary Table 11 and Supplementary Table 13 for weight and height, respectively, and were generated using linear spline multi-level models. cLoF = complete loss of function; GoF = gain of function; LoF = loss of function; pLoF = partial loss of function; WT-like = wild-type like.

