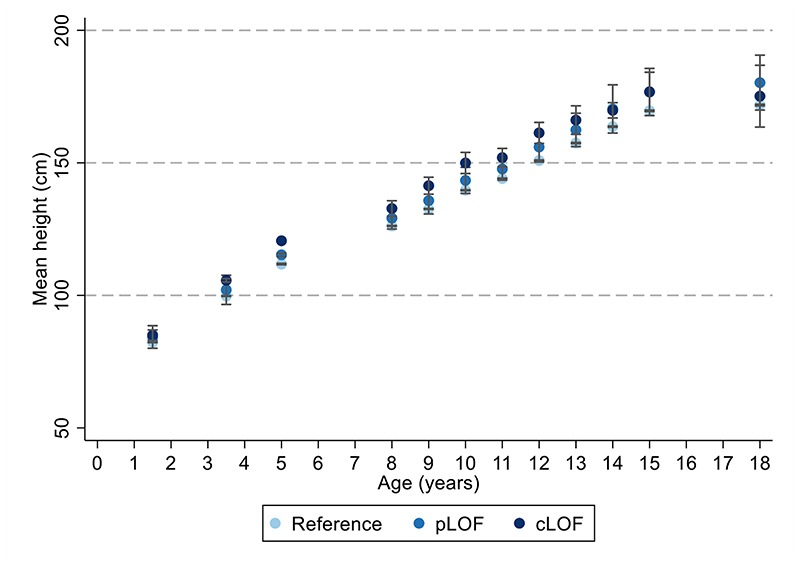
Extended Data Figure 4. Mean height across time with MC4R LoF of cAMP accumulation.
Mean height +/- 95% CI at different ages (sample sizes across ages presented in Supplementary Table 4) with MC4R LoF of cAMP (carriers of pLoF and cLoF) and the reference group (i.e., non-LoF carriers – combining individuals with synonymous, common variations or no LoF mutations and individuals with WT-like and GoF mutations). Figures only show results where all mutational groups (i.e., WT-like, GoF, pLoF and cLoF mutations) were represented by at least one individual at all time points between birth and 24 years. CI = confidence interval; cLoF = complete loss of function; GoF = gain of function; LoF = loss of function; pLoF = partial loss of function; WT = wild-type.

