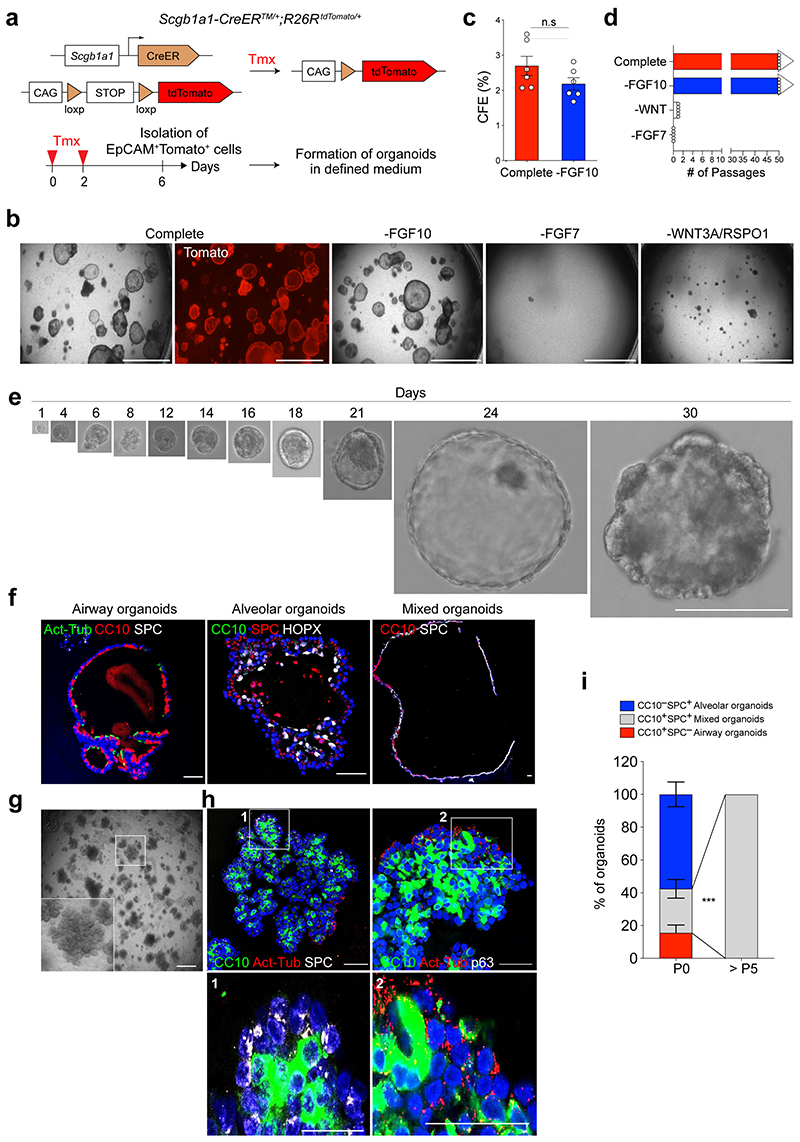
Figure 1. Establishment of feeder-free organoids derived from distal secretory cells.
a, Experimental design for isolation of Scgb1a1 lineage-labelled cells. Scgb1a1 lineage-labelled cells were isolated at day 4 after final tamoxifen treatment. b, Representative bright-field or fluorescent images of organoids derived from lineage-labelled Tomato+Scgb1a1+ cells in indicated conditions; complete medium (See Methods) with WNT3A, RSPO1 (R-spondin 1), EGF, FGF7, FGF10, and NOG (Noggin), withdrawal of indicated factors (–FGF10, –FGF7, or –WNT3A/RSPO1). Scale bar, 2,000μm. c, d, Statistical quantification of colony forming efficiency (n=6) (c) and passaging numbers (n=5) (d) of organoids. Each individual dot represents one biological replicate and data are presented as mean and s.e.m. n.s; not significant. e, Representative serial bright-field images of a lung organoid growing originated from single Tomato+Scgb1a1+ cells at the indicated time points. Magnifications: X20 (day 0 and 4), X10 (day4-21), and X4 (day 24 and 30). Scale bars, 200μm. f, Representative immunofluorescence (IF) images of three distinctive types of organoids derived from Tomato+Scgb1a1+ cells at the establishment under feeder-free condition with complete culture medium; Airway organoids retaining CC10+ secretory and Act-Tub+ ciliated cells (left), Alveolar organoids retaining SPC+ AT2 and HOPX+ AT1 cells (middle), and Mixed organoids retaining both CC10+ secretory and SPC+ AT2 cells (right). CC10 (for secretory cells, red or green), Acetylated-Tubulin (Act-Tub, for ciliated cells, green), SPC (for AT2 cells, white), HOPX (for AT1 cells, white), and DAPI (blue). Scale bars, 50μm. g, Representative bright-field images of organoids under feeder-free condition with complete culture medium at passage 5. Insets show high-power view. Scale bars, 2,000μm. h, Representative IF images of mixed organoids cultured in complete medium at passage 5. CC10 (green), Act-Tub (red), SPC (white, left), p63 (for basal cells, white, right), and DAPI (blue). Insets (1, 2) show high-power view. Scale bars, 50μm. i, Quantification of each organoid types in complete medium at passage 0 and over passage 5; Airway organoids (CC10+SPC−; red), Alveolar organoids (CC10−SPC+; blue), and Mixed organoids (CC10+SPC+; grey). Data are presented as mean and s.e.m. (n=3 independent experiment). Statistical analysis was performed using two-tailed unpaired Student’s t test; ***p=0.002.

