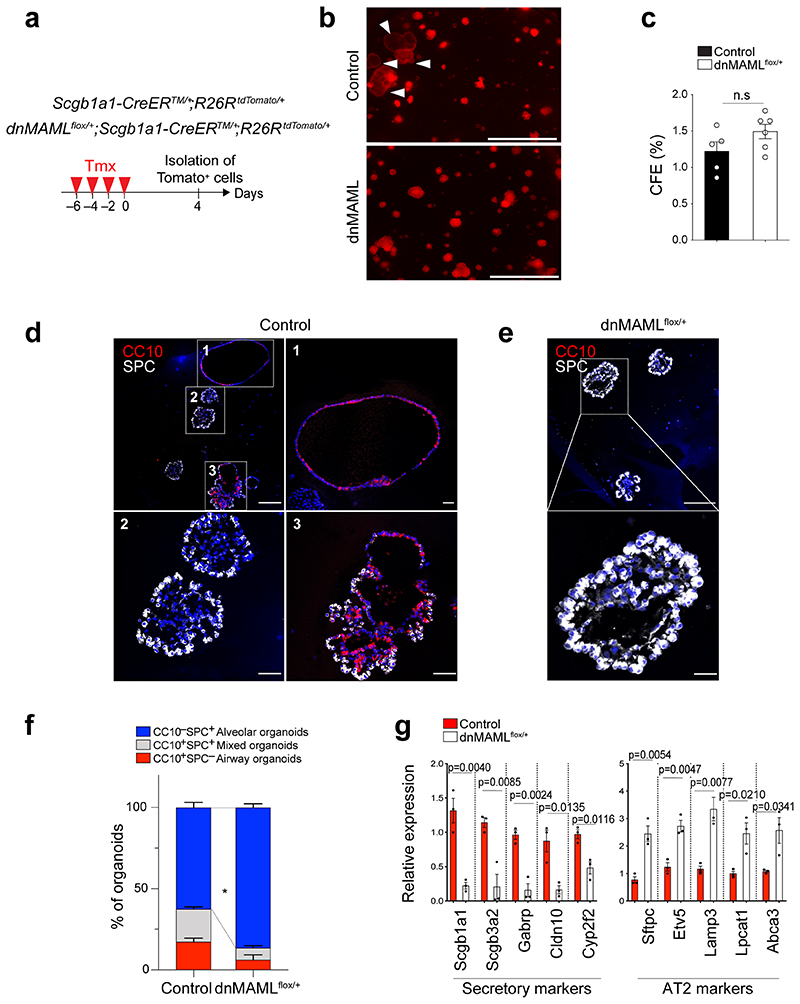
Extended Data Fig. 3. Organoid co-culture shows enhanced differentiation of secretory cells into AT2 cells by downregulation of Notch activity.
a, Experimental design for isolation of lineage-labelled secretory cells from Scgb1a1-CreERTM/+;R26RtdTomato/+ and dnMAMLfloX+;Scgb1a1-CreERTM/+; R26RtdTomato/+ mice at indicated time points after tamoxifen treatment. b, Representative fluorescent images of organoids derived from control or dnMAML-expressing lineage-labelled secretory cells. 5,000 cells of lineage-labelled secretory cells (Tomato+EpCAM+CD45-CD31-) isolated from Scgb1a1-CreERTM/+;R26RtdTomato/+ or dnMAMLflox/+;Scgb1a1-CreERTM/+;R^26RtdTomato/+ mouse lungs were co-cultured with stromal cells with 1:5 ratio for 14 days. Arrowheads point to cystic airway-like organoids. Scale bar, 2,000μm. c, Statistical quantification of colony forming efficiency of organoids. Each individual dot represents one biological replicate (n=5 for control, n=6 for dnMAMLflox/+) and data are presented as mean and s.e.m. Statistical analysis was performed using two-tailed unpaired Student’s t test; n.s; not significant. CFE; Colony forming efficiency units. d, Representative IF images of three distinctive types of organoids derived from control secretory cells; Airway organoids (CC10+SPC-; denoted as 1), Alveolar organoids (CC10-SPC+; denoted as 2), and Mixed organoids (CC10+SPC+; denoted as 3). CC10 (for secretory cells, red), SPC (for AT2 cells, white), and DAPI (blue). Insets (1, 2 and 3) show high-power view. Scale bars, 50μm and 10μm (in high-power view). e, Representative IF images of alveolar organoids derived from dnMAML-expressing secretory cells. CC10 (for secretory cells, red), SPC (for AT2 cells, white), and DAPI (blue). Insets show high-power view. Scale bars, 50μm (10μm in high-power view). f, Quantification of each organoid types derived from Scgb1a1-CreERTM/+;R26RtdTomato/+ or dnMAMLfloX+;Scgb1a1-CreERTM/+;R26RtdTomato/+ mice in (d and e); Airway organoids (CC10+SPC-; red), Alveolar organoids (CC10-SPC+; blue), and Mixed organoids (CC10+SPC+; grey). Data are presented as mean and s.e.m (n=3 biological replicates). Statistical analysis was performed using two-tailed unpaired Student’s t test; *p=0.0358. g, qPCR analysis of markers for secretory (Scgb1a1, Scgb3a2, Gabrp, Cldn10, and Cyp2f2) and AT2 (Sftpc, Etv5, Lamp3, Lpcat1, and Abca3) cells in organoids isolated from Scgb1a1-CreERTM/+;R26RtdTomato/+ (black bars) and dnMAMLflox/+;Scgb1a1-CreERTM/+; R26RtdTomato/+ mice (white bars). Data are presented as mean ± s.e.m (n=3 biological replicates). Statistical analysis was performed using two-tailed unpaired Student’s t test; P-values are indicated in the figure.

