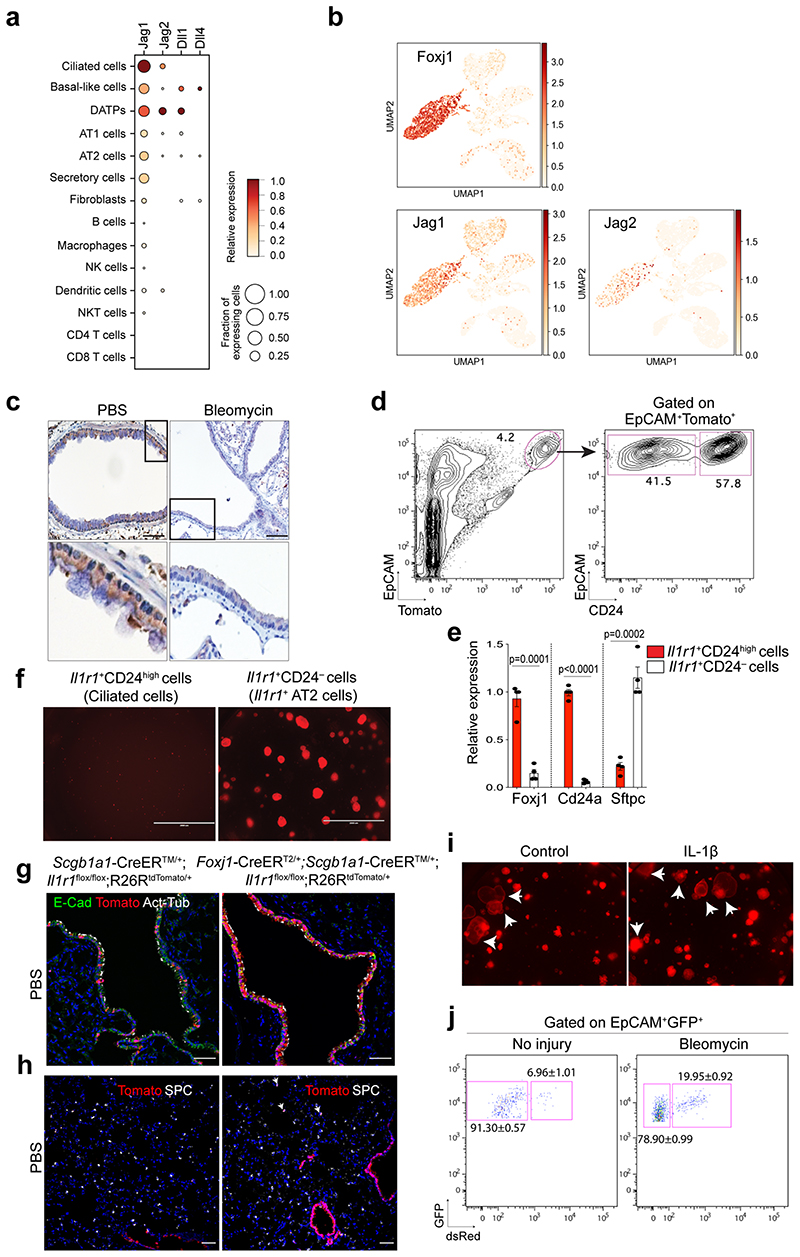
Extended Data Fig. 7. Expression of Notch ligands in ciliated cells post alveolar injury.
a, Expression of Notch ligand in each distinctive cluster revealed in Extended Data Fig. 6. The size of the circle represents the fraction of cells expressing the gene and the colour represents the relative expression of each gene. b, UMAP visualisation of the log-transformed (log10(TPM+1)), normalised expression of selected marker genes (Jag1 and Jag2 for Notch ligand expression; Foxj1 for ciliated cells) in distinctive clusters. c, Representative IHC images stained with anti-Jag1 in the distal airway of lungs from Scgb1a1-CreERTM/+;R26RtdTomato/+ mice at day 14 post PBS or bleomycin treatment. Insets (top) show high-power view (bottom). Scale bars, 50μm. d, Sorting strategy for Il1r1+ lineage-labelled ciliated (EpCAM+Tomato+CD24high) and AT2 (EpCAM+Tomato+CD24-) cells from Il1r1-CreERT2/+; R26RtdTomato/+ mouse lungs at day 4 post tamoxifen injection. e, qPCR analysis of Foxj1, Cd24, and Sftpc expression in isolated cells in (d). Each individual dot represents one individual experiment (n=4) and data are presented as mean ± s.e.m. P-values using Student’s t-test are indicated in the figure. f, Representative fluorescent images of organoids derived from Il1r1 lineage-labelled ciliated (Il1r1 +CD24high) or AT2 (Il1r1 +CD24-) cells. Ciliated cells are unable to form organoids. Scale bars, 2,000μm. g, Representative IF images showing intact ciliated cells in the lungs of Il1r1flox/flox; Foxjl-CreERT2/+; Scgb1a1-CreERTM/+;R26RtdTomato/+ mice compared to those in the lungs of control Illrlflox/flox; Scgb1a1-CreERTM/+;R26RtdTomato/+ mice: Tomato (for Scgb1a1 or Foxj1 lineage, red), Acetylated Tubulin (Act-Tub, white), E-Cadherin (E-Cad, green), and DAPI (blue). Scale bars, 50μm. h, Representative IF images showing a small number of Scgb1a1 lineage-labelled AT2 cells at day 28 post PBS treatment in Scgb1a1-CreERTM/+;Il1r1flox/flox;R26RtdTomato/+ or Foxj1-CreERT2/+;Scgb1a1-CreERTM/+;Il1rflox/flox;R26RtdTomato/+ mice. Tomato (for Scgb1a1 lineage, red), SPC (white), and DAPI (blue). Arrowheads point to lineage-labelled SPC+ AT2 cells. Scale bar, 100μm. i, Representative fluorescent images of organoids derived from lineage-labelled secretory cells of Scgb1a1-CreERTM/+ ;R26RtdTomato/+ lungs. Organoids were cultured with PBS or IL-1β for 14 days. Arrows point to cystic airway-like organoids. Scale bar, 2,000μm. j, Flow cytometry analysis of secretory cell-derived AT2 cells isolated from Scgb1a1-CreERTM/+R26RfGFP/+;Sftpc-dsRedIRES-DTR/+ mouse lungs after PBS (left) or bleomycin (right) treatment.

