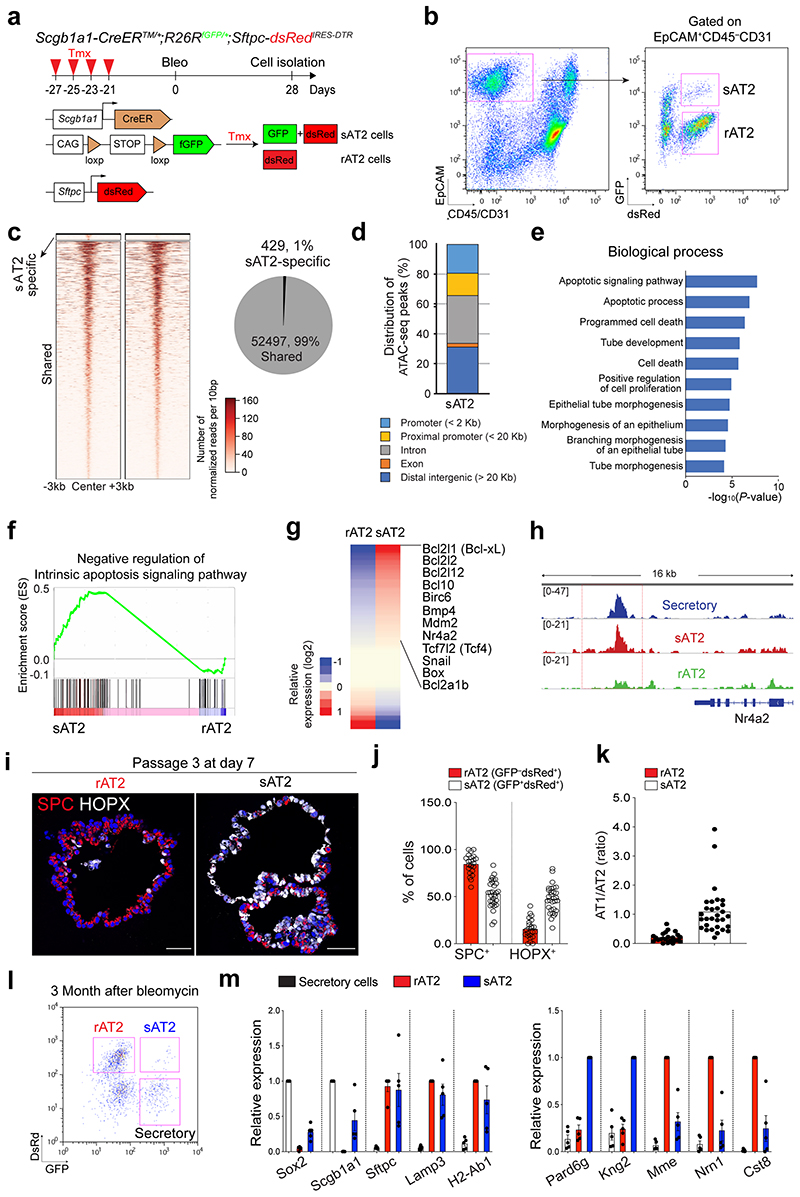
Extended Data Fig. 9. Genetic and epigenetic differences of sAT2 cells compared to rAT2 cells.
a, Experimental design for isolation of secretory-derived (sAT2, GFP+dsRed+) and resident AT2 cells (non-lineage-labelled AT2, rAT2, GFP-dsRed+) using Scgb1a1-CreERTM/+; R26RfGFP/+;Sftpc-dsRedIRES-DTR/+ mice. Specific time points for tamoxifen injection and isolation are indicated. b, Representative flow cytometry analysis for isolation of sAT2 (GFP+dsRed+) and rAT2 (GFP-dsRed+) cells. c, Heatmaps showing open chromatin regions specific in sAT2 cells and shared open chromatin regions between sAT2 cells and rAT2 cells (left). A pie chart presenting the proportion of sAT2-specific (blue) and shared regions (grey) (right). d, A bar graph showing the chromosomal distribution of sAT2-specific ATAC-seq peaks mapped in (c). e, A bar graph showing enriched GO terms of the genes nearby sAT2-specific peaks. f, GSEA with gene sets representing the negative regulation of intrinsic apoptosis signalling pathway in scRNA-seq data of sAT2 and rAT2 shown in Fig. 6a. g, A heatmap showing the expression patterns of the genes belonging to the negative regulation of apoptosis signalling pathway in sAT2 and rAT2 cells monitored by scRNA-seq (Fig. 6a). h, Signal track image showing open regions for Nr4a2, anti-apoptotic pathway marker, in secretory (blue), sAT2 (red), and rAT2 cells (green). i, Representative IF images of organoids derived from rAT2 or sAT2 cells. SPC (for AT2 cells, red), HOPX (for AT1 cells, white), and DAPI (blue). Scale bars, 50μm. j, k, Quantification of the frequency of AT2 (SPC+) or AT1 (HOPX+) cells (b) and the ratio of AT1/AT2 cells (c) in rAT2- or sAT2-derived organoids. (n=23 organoids, pooled from 2 mice for rAT2; n=30 organoids, pooled from 2 mice for sAT2). l, Flow cytometry analysis of Scgb1a1+ lineage-labelled AT2 cells isolated from Scgb1a1-CreERTM/+;R26RfGFP/+;Sftpc-dsRedIRES-DTR/+ mouse lungs at 3 months after bleomycin injury. m, qPCR analysis of the genes in isolated secretory, rAT2, or sAT2 cells. Data are presented as mean ± s.e.m (n=5 biological replicates for all experimental groups).

