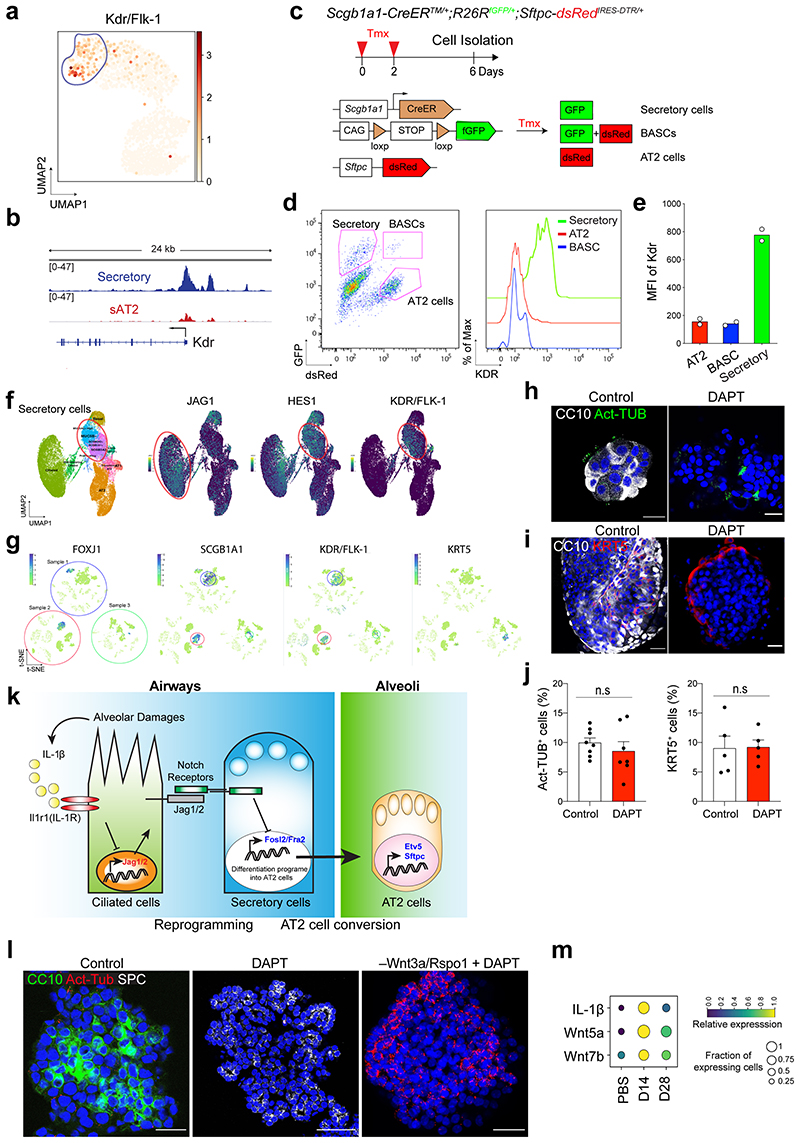
Extended Data Fig. 10. Identification of KDR/Flk-1 as a surface marker of secretory cells in both mouse and human lungs.
a, UMAP visualisation of normalised expression of Kdr/Flk-1. b, A signal track image showing open regions nearby Kdr mapped in secretory (blue) and sAT2 cells (red). c, Experimental design for isolation of CC10+SPC- secretory cells, CC10+SPC+ dual-positive cells including Bronchioalveolar stem cells (BASCs), and CC10-SPC+ AT2 cells from Scgb1a1-CreERTM/+;R26RfGFP/+;Sftpc-dsRedIRES-DTR/+ mice. d, Representative flow cytometry analysis (left) for secretory (GFP+dsRed-), BASCs (GFP+dsRed+), and AT2 (GFP-dsRed+) cells. e, A bar graph showing MFI (mean fluorescence of intensity) of KDR expression. Experiment performed twice. f,g, UMAP (f) or t-SNE (g) visualisation of the normalised expression of JAG1, HES1, and KDR from the dataset of Habermann et al.,45(f) or Travaglini et al.,46(g). h,i, Representative IF images of secretory cell-derived organoids treated with DMSO or DAPT (20μM). CC10 (white), Acetylated Tubulin (Act-Tub, green, h), KRT5 (red, i), and DAPI (blue). Scale bar, 50μm. j, Quantification of the frequency of Act-Tub+ ciliated cells or KRT5+ basal cells. Data are presented as mean ± s.e.m. (n=8 (Control) and n=7 (DAPT) organoids, pooled from 3 mice for Act-TUB+ cells; n=5 (Control) and n=8 (DAPT) organoids, pooled from 3 mice for KRT5+ cells). Statistical analysis was performed using two-tailed unpaired Student’s t test; n.s.=not significance. k, Notch inhibition coordinates the cell fate decision of secretory cells into AT2 cells in two stages: 1) Reprogramming; loss of secretory cell identity by Notch inhibition in response to IL-1β signaling and 2) AT2 cell conversion; acquisition of transcriptional programmes for AT2 cell differentiation vis the transcription regulator Fosl2. l, Representative IF images of secretory organoids treated with DMSO (control) or DAPT (20μM) in the presence (middle) or withdrawals of Wnt-inducing factors (right). Organoids were cultured in the medium supplemented with Wnt3a/Rspo1 for 7 days and then DAPT was treated for further 7 days with or without Wnt3a/Rspo1. CC10 (for secretory cells, green), Acetylated Tubulin (for ciliated cells, Act-Tub, red), SPC (for AT2 cells, white), and DAPI (blue). Scale bars, 50μm. m, The expression of IL-1β, Wnt5a, and Wnt7b at indicated time points after bleomycin injury. Data were from our previous study31.

