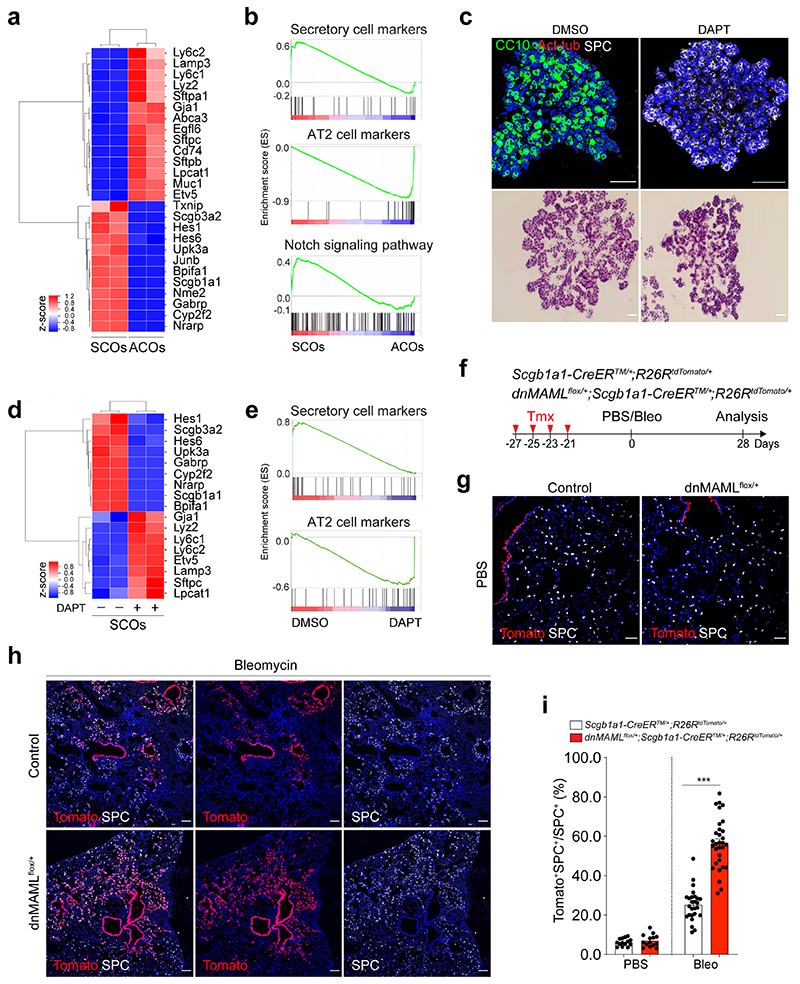
Figure 2. Enhanced differentiation of secretory cells into AT2 cells by inhibition of Notch activity upon lung injury.
a, A heatmap showing normalised expression data for secretory and AT2 cell markers that were differentially expressed in secretory cell-derived organoids (SCOs) or AT2 cell-derived organoids (ACOs) cultured with defined media at passage 10. Values are z-scores. b, Gene set enrichment analysis (GSEA) showing the gene activity of the three gene sets for secretory cells (top), AT2 cells (middle), and Notch signalling pathway-related in SCOs or ACOs c, Representative IF (top) and H&E (bottom) images of organoids in treatment with DMSO (control) and DAPT at day 14. DAPT (20μM) were treated every other day during organoid culture. CC10 (green), Acetylated-Tubulin (Act-Tub, red), and SPC (white), and DAPI (blue). Scale bar, 50μm. d, A heatmap showing normalised expression data for Notch signalling related, secretory and AT2 cell marker genes that were differentially expressed in SCOs with or without DAPT treatment for 14 days. Values are z-scores. e, GSEA with two gene sets representing markers for secretory (left) and AT2 cells (right) in SCOs with or without DAPT treatment. f, Experimental design of lineage-tracing analysis for contribution of secretory cells into alveolar lineages by inhibition of Notch signalling using Scgb1a1-CreERTM/+;R26RtdTomato/+ and dnMAMLflox/+;Scgb1a1-CreERTM/+;R26RtdTomato/+ mice after bleomycin (Bleo) injury. Specific time points for tamoxifen injection and tissue analysis are indicated. g, h, Representative IF images showing the derivation of Scgb1a1 lineage-labelled AT2 cells in PBS-treated control (g) or bleomycin-treated (h) mice at day 28. Tomato (for Scgb1a1 lineage, red), SPC (white), and DAPI (blue). Scale bar, 100μm. i, Statistical quantification of Scgb1a1+ lineage-labelled AT2 cells (n=14 sections (PBS), n=14 sections (Bleo), pooled from 2 mice for Scgb1a1-CreERTM/+;R26RtdTomato/+ ; n=26 sections (PBS) and n=31 sections (Bleo), pooled from 4 mice for dnMAMLflox/+;Scgb1a1-CreERTM/+;R26RtdTomato/+). Data are presented as mean ± s.e.m. Statistical analysis was performed using two-way ANOVA; ***p<0.0001.

