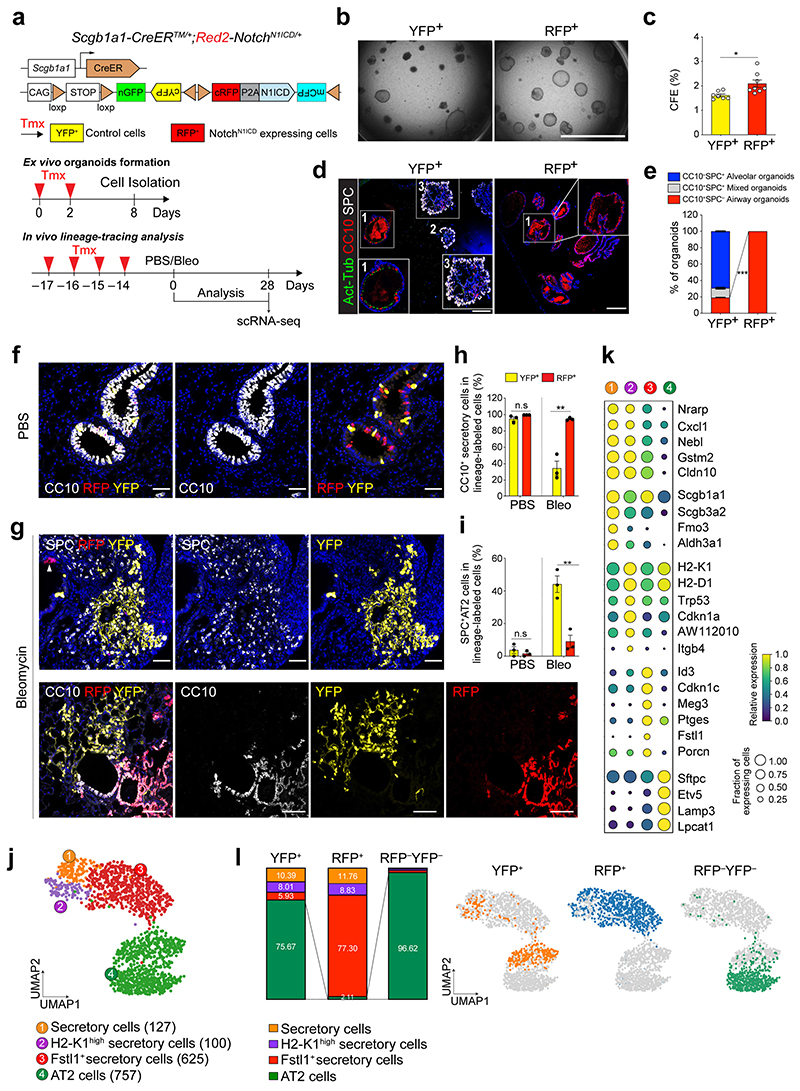
Figure 3. Impaired contribution of secretory cells into AT2 cell regeneration by sustained Notch activity.
a, Experimental design of ex vivo organoid co-culture with stromal cells, lineage-tracing analysis, and scRNA-seq analysis using Scgb1a1-CreERTM/+; Red2-NotchN1ICD/+ mice after bleomycin injury. Specific time points for tamoxifen injection and analysis for tissue and scRNA-seq are indicated. b, c, Representative bright-field images (b) and colony forming efficiency (CFE) of organoids derived from control YFP+ (left) and N1ICD-expresing RFP+ (right) cells. Scale bar, 2,000μm. Data are presented as mean and s.e.m. Statistical analysis (n=7 biological replicates for YFP, n=8 biological replicates for RFP) was performed using two-tailed unpaired Student’s t test; *p=0.0141. d, Representative IF images of three distinctive types of organoids in (b); Airway organoids (CC10+SPC−, 1), Alveolar organoids (CC10−SPC+, 2), and Mixed organoids (CC10+SPC+, 3). CC10 (secretory cells, red), Act-Tub (ciliated cells, green), SPC (AT2 cells, white), and DAPI (blue). Insets (1 and 3) show high-power view. Scale bars, 50μm. e, Quantification of each organoid types in (d), Data are presented as mean and s.e.m (n=3 biological replicates). ***p<0.0001 (Student’s t test). f, Representative IF images showing the derivation of YFP+ or RFP+ cells in control mice at day 28 post PBS treatment. YFP (yellow), RFP (red), CC10 (white), and DAPI (blue). Scale bar, 50μm. g, Representative IF images showing the derivation of YFP+ or RFP+ cells at day 28 post bleomycin treatment. YFP (yellow), RFP (red), SPC (top, white), CC10 (bottom, white), and DAPI (blue). Arrowhead points to RFP+ cells. Scale bar, 50μm. h, i, Statistical quantification of CC10+ secretory (h) and SPC+ AT2 (i) cells derived from YFP+ or RFP+ cells at day 28 post PBS or bleomycin treatment. Data (n=3 biological replicates) are presented as mean ± s.e.m. **p=0.025 (h), p=0.0052 (i) from Student’s t test. j, Secretory and AT2 cell population were further analysed from scRNA-seq results (Extended Data Fig. 7b). Number of cells in the individual cluster is depicted in the figure. k, Gene expression of key markers in each distinctive cluster. l, Quantification (left) and UMAP (right) of distribution of each cluster across indicated lineage-labelled cells after injury.

