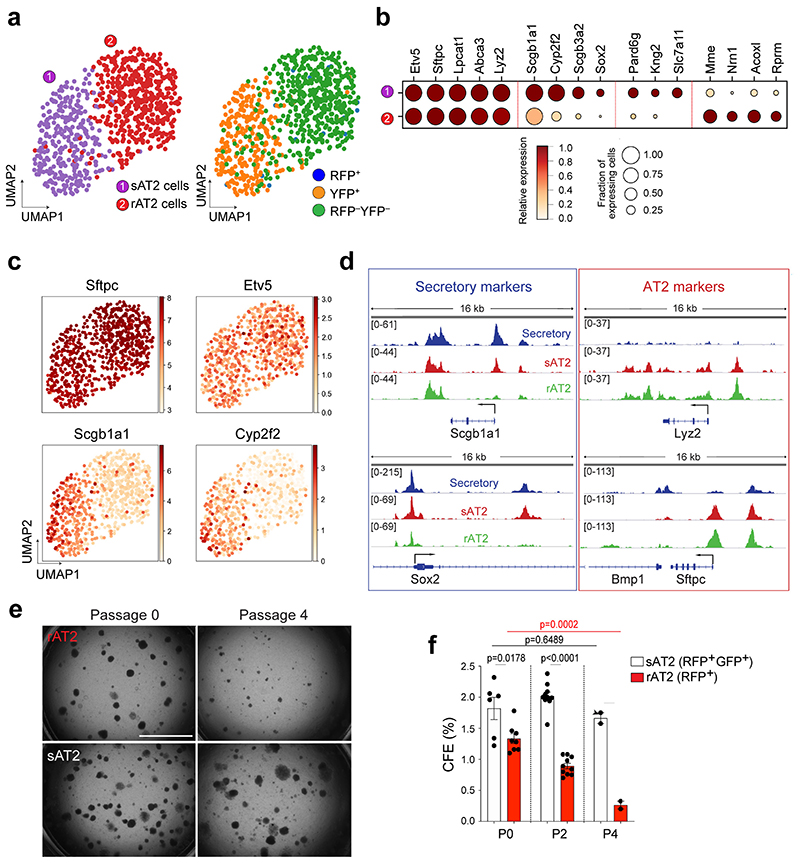
Figure 6. Distinctive features of secretory-derived AT2 cells.
a, UMAP visualisation of two distinctive AT2 cell clusters sAT2 (secretory cell-derived AT2, YFP+SPC+ cluster); rAT2 (resident AT2, YFP−RFP− non-lineage labelled SPC+ cluster) from scRNA-seq analysis of Scgb1a1-CreERTM/+;Red2-NotchN1ICD/+ mice in Fig. 3j. b, Gene expression of key markers in sAT2 and rAT2 cell clusters. c, UMAP visualisation of the log-transformed (log10(TPM+1)), normalised expression of selected marker genes (Sftpc and Etv5 for AT2 cells. Scgb1a1 and Cyp2f2 for secretory cells) in distinctive clusters shown in (a). d, Signal track images showing open regions of markers for secretory (Scgb1a1 and Sox2) and AT2 cells (Lyz2 and Sftpc) mapped in secretory (blue), sAT2 (red), and rAT2 cells (green) from the result of Fig. 5c. e, Representative bright-field images of organoids derived from rAT2 (top) or sAT2 (bottom) cells: Experiment scheme for labelling with tamoxifen is same as Fig. 5a. Scgb1a1-CreERTM/+;R26RfGFP/+;Sftpc-dsRedIRES-DTR/+ mice was given four doses of tamoxifen followed by bleomycin injury. Isolated GFP+dsRed+ (sAT2) and GFP–dsRed+ (rAT2) cells at 2 months post bleomycin injury were co-cultured with stromal cells with 1:5 ratio. Images show the organoids at passage 0 and 4. Scale bar, 2,000μm. f, Statistical quantification of colony forming efficiency (CFE) of indicated organoids. Each individual dot represents individual biological replicate (n=6 and 8 for Passage 0, n=10 for passage 2, and n=2 for passage 4) and data are presented as mean ± s.e.m. Statistical analysis was performed using two-tailed unpaired Student’s t test; P-values are indicated in the figure.

