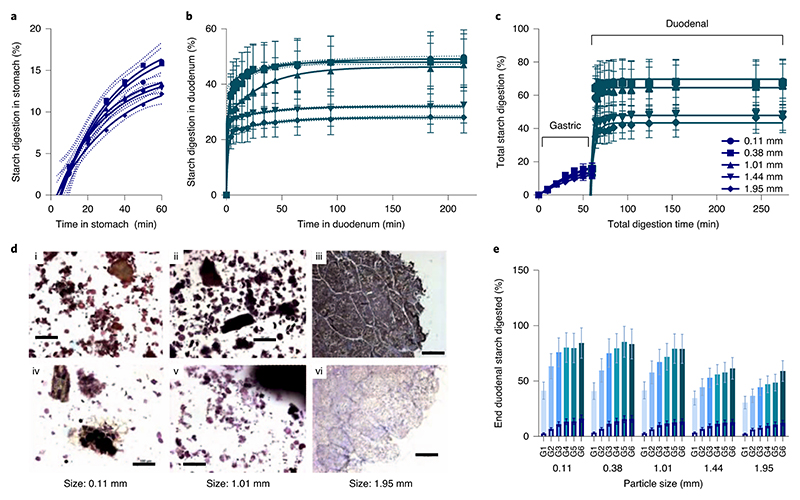
Figure 5. Gastric and duodenal digestion of wheat porridges with contrasting particle size.
Wheat porridges made with different particle size fractions of milled endosperm were digested using a dynamic gastric model followed by a static duodenal model. Starch digestibility curves show the percent of total starch that has been digested at each time point from wheat endosperm porridge with contrasting particle sizes in the stomach (a) and duodenum (b). Profiles shown in panel b and c are of samples subjected to 60 min gastric residence, wherein the gastric baseline has been subtracted (b), or included to give the total amount of starch amylolysis (c). Curve fits were obtained by least square regression to one (a, R 2 > 0.98) or two (b, R 2 > 0.99) - phase association equations, with 95% confidence bands shown. (d) Micrographs of particle size 0.11 mm (d1,d4), 1.01 mm (d2,d5) and 1.95 mm (d3,d6) captured before (d1,d2), mid-gastric (d3) and after duodenal digestion (d4,d5,d6), were all stained with KI, scalebar = 100 μm. (e) Clustered column chart showing % of total starch that has been digested at the end of duodenal phase, clustered by particle size and with a separate column shown for each gastric residence time (10-60 min). All experimental points are the mean of three determinations obtained from three simulated digestion runs and the error bars show 20% standard error. The overlaid columns with a dark border represent the starch released from each sample during the gastric phase.

