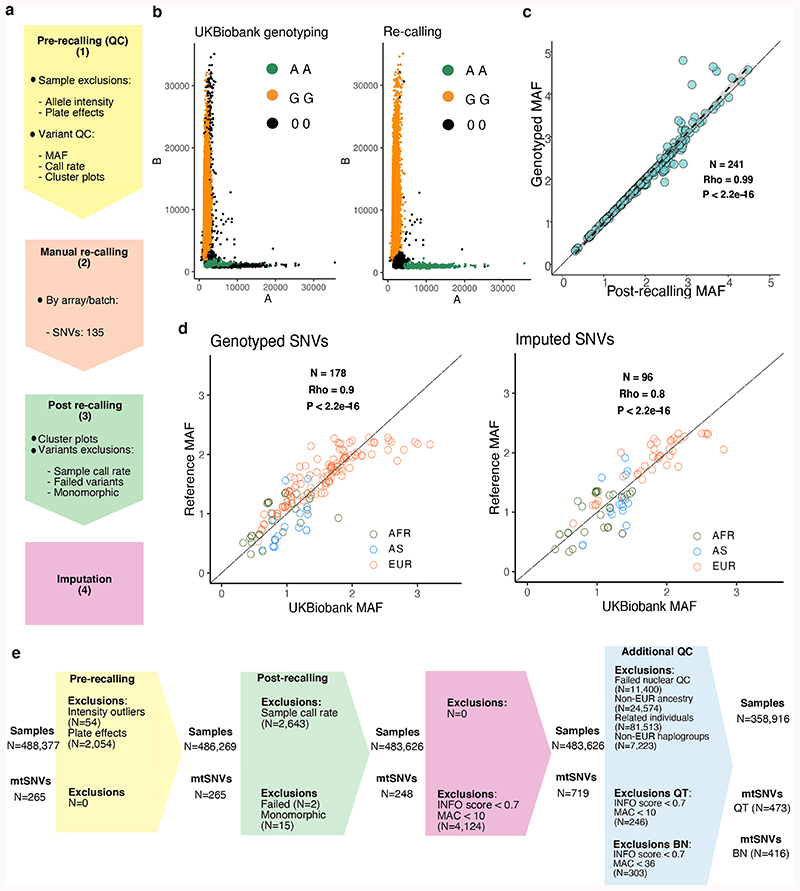
Figure 1. Mitochondrial genome PheWAS workflow.
(a) Quality control (QC) workflow: the steps taken to assure genotype quality are listed. The stages were as follows: (1) pre-recalling QC, (2) manual re-calling, (3) post-re-calling QC, and (4) imputation of mtSNVs not genotyped on the arrays. (b) Examples of probe intensities cluster plots for a mtSNV (m.14869G>A) pre- and post-recalling genotyped in the “Full set” (N = 483,626 participants); color legend corresponds to genotype assignment with black dots indicate missing genotypes. (c) Scatterplot showing correlation of -log10 MAFs of the 241 recalled mtSNVs compared to UKBB genotyped mtSNVs. The long dashed lines indicate y=x and the short dashed lines the linear regression fit. The grey shaded area represents the 95% confidence interval of the regression fit. Spearman’s correlation, two-sided P-value (P = 1.8x10-205) and rho are provided. (d) Scatterplots showing correlation of -log10 MAFs of the genotyped mtSNVs post-recalling (left plot) and the imputed variants (right plot) in UKBB mtSNVs compared to GenBank mtSNVs (MAC≥30). Spearman’s correlation, two-sided P-value (P = 8.6x10-65 for genotyped SNVs; P = 1.8x10⁻²⁶ for imputed SNVs) and rho are provided. Color coding represents the population each mtSNV is tagging (green = African, blue = Asian, orange = European population). The UKBB individuals with nuclear-mitochondrial matched African (AFR, N=2012 participants), Asian (AS, N=888 participants) and European (EUR, N=358,916, unrelated participants) ancestries were compared to corresponding GenBank genomes (EUR, N=6,593, AFR, N = 704, AS, N = 3,587). (e) CONSORT-like diagram showing the breakdown of people and mtSNVs excluded at each step of the study. Colors correspond to the following steps: light yellow = pre-calling, peach = manual re-calling, light green = post re-calling, pink = imputation. INFO = IMPUTE2 score; MAC = minor allele count; BT = binary trait; QT = quantitative trait.

