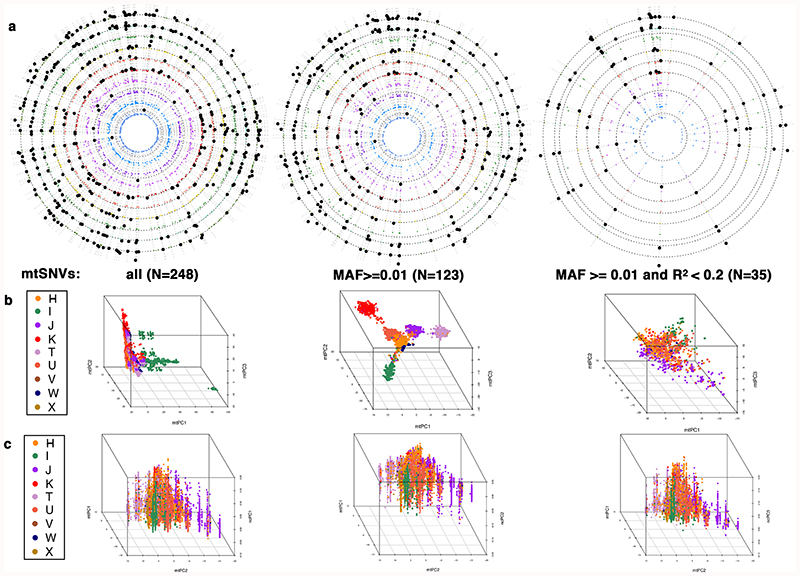
Extended Data Fig. 2. Relationship between population structure in the nuclear and mitochondrial genomes.
The figure shows (a) circular Manhattan plots of the association between the first 10 nucPCs and mtSNVs. For each mtSNV, the association was tested using a linear regression model: Y~ β1 x X1 + β2 x X2 + β3 x X3 + β4 x X4 + β5 x X5 where Y is a vector containing the values of a nucPC, X1 is a vector of mtSNV dosages and X2-X5 are vectors containing covariate values (age, age squared, sex, and array) and β1-5 represent the effect of each variable on the mean of Y. Wald test two-sided P-values are presented. The nucPCs are ordered from PC1 to PC10 from outside to in and black dots represent (Wald test, two-sided) P <5x10⁻⁵; (b) 3D plots of the first three mtPCs; and (c) the relationship between the first three nuclear principal components (nucPCs, nucPC1 - left, nucPC2 - middle, nucPC3 - right) and the first two mitochondrial principal components (mtPCs). The latter were calculated using mtSNVs with MAF>0.01 and R2<0.2. The mtPCs in (a) and (b) were calculated using the following sets of genotyped mtSNV: (from left to right) all mtSNVs; mtSNVs with MAF>0.01 only; and mtSNVs with MAF>0.01 after LD-pruning at R2<0.2. N=the number of mtSNVs included in a given analysis. In (b) and (c) individuals are coloured according to macro-haplogroup carrier status.

