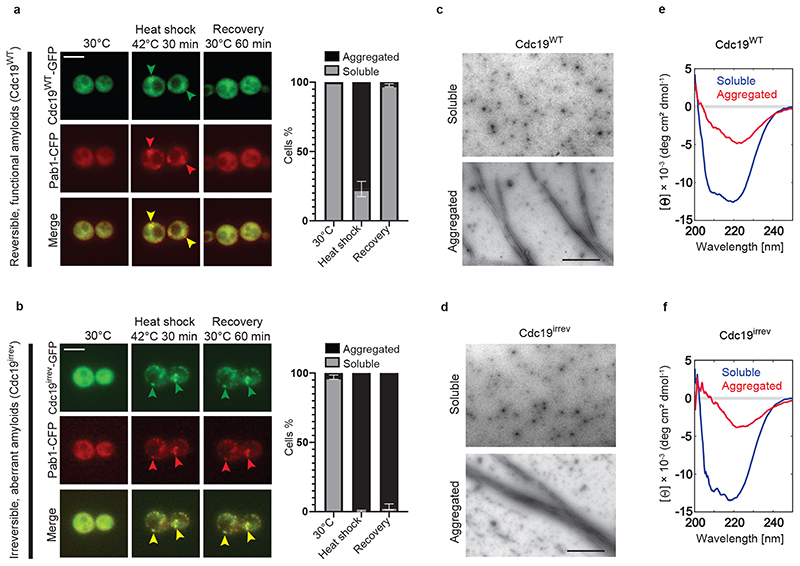
Figure 1. SG disassembly depends on re-solubilization of Cdc19 amyloids.
(A) – (B) Cdc19WT-GFP and Cdc19irrev-GFP cells expressing the SG marker Pab1-CFP were grown at 30 °C, and subjected to heat stress for 30 min at 42 °C before recovery at 30 °C. Representative images taken at the indicated time points are shown. Merged images demonstrate co-localization (arrowheads). Plots indicate mean percentage (%) of cells with Cdc19 aggregates ± S.E.M (n = 3 independent experiments, >30 cells per sample per experiment). Scale bar: 5 μm.
(C) – (D) Cdc19WT or Cdc19irrev proteins purified from E. coli were imaged by negative staining transmission electron microscopy (TEM). Representative images of three independent experiments are shown. Scale bar: 2 μm.
(E) – (F) Cdc19WT or Cdc19irrev proteins purified from E. coli were analyzed by circular dichroism (CD) before (soluble) or after a 10 min heat shock at 42 °C (aggregated). Representative images of three independent experiments are shown. Source data for all graphical representations can be found in Source Data Fig. 1.

