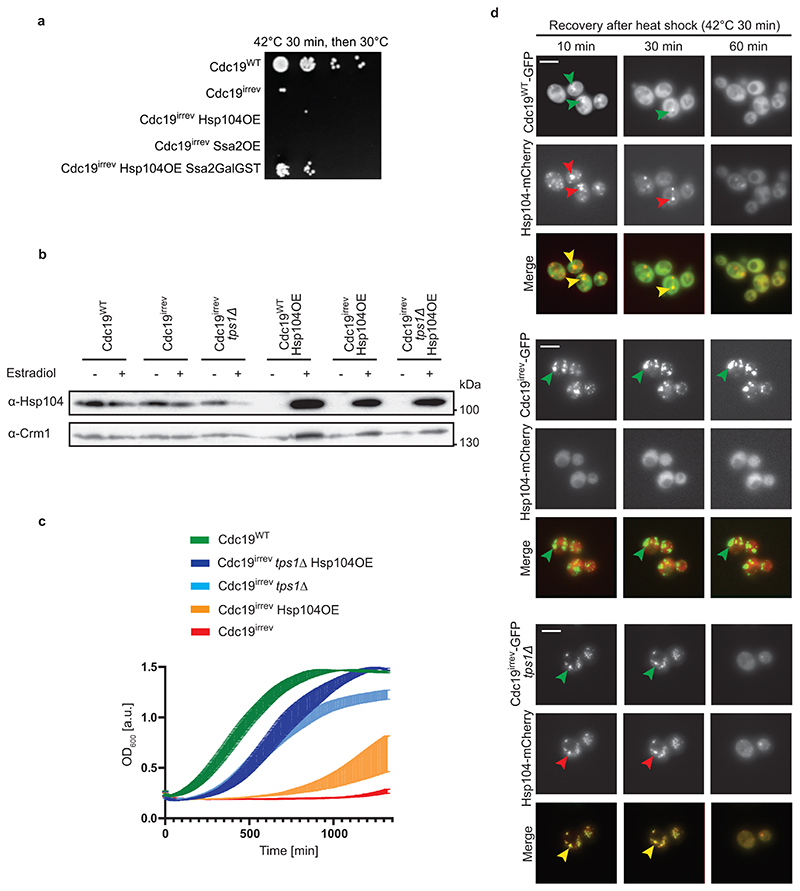
Extended Data Fig. 4. The chaperones Hsp104 and Ssa2 co-operate with FBP to efficiently disassemble Cdc19 amyloids in vivo .
(A) Co-overexpression of Hsp104 and Ssa2 partially restores growth of cdc19irrev cells after heat stress. cdc19WT and cdc19irrev cells overexpressing as indicated Hsp104 or Ssa2, or both together by addition of 10 mM estradiol for 3 hours were treated for 30 min at 42 °C. Serial dilutions were spotted on agar plates and grown at 30 °C for 3 days. The image is representative of three independent experiments.
(B) Hsp104 protein levels were quantified in the indicated strains by Western blot either in the absence (-) or presence (+) of 10 mM estradiol for 3 hours. The image is representative of three independent experiments. Unprocessed original scans of blots are shown in Source data Extended data fig. 4.
(C) Increased FBP levels and Hsp104 co-operate to efficiently restart growth after stress in cdc19irrev cells. Exponentially growing wild-type or tps1Δ cells expressing either Cdc19WT or Cdc19irrev were subjected to a 30 min heat shock at 42 °C. Where indicated, overexpression of Hsp104 was induced by treating cells with 10 mM estradiol for 3 hours. Growth restart after stress release of the indicated strains was quantified by measuring the cell density (OD600) over time after inoculation of equal cell numbers at 30 °C. Mean cell density 22 hours after stress release is shown, with error bars representing S.E.M. of three independent experiments. Note that Hsp104 overexpression and increased FBP levels co-operate to rescue cdc19irrev cells after heat shock.
(D) Wild-type or tps1Δ cells co-expressing mCherry-tagged Hsp104 and either GFP-tagged Cdc19WT or Cdc19irrev mutant were heat stressed for 30 min at 42 °C and imaged by fluorescence microscopy at the times indicated (minutes). Representative GFP- (left row) and mCherry-images (middle row) are shown, together with the merged image (bottom row) to visualize co-localization of Cdc19 aggregates and Hsp104. Images are representative of three independent experiments. Scale bar: 5 μm. Source data for the graphical representation and unprocessed Western blots can be found in Source Data Extended Data Fig. 4.

