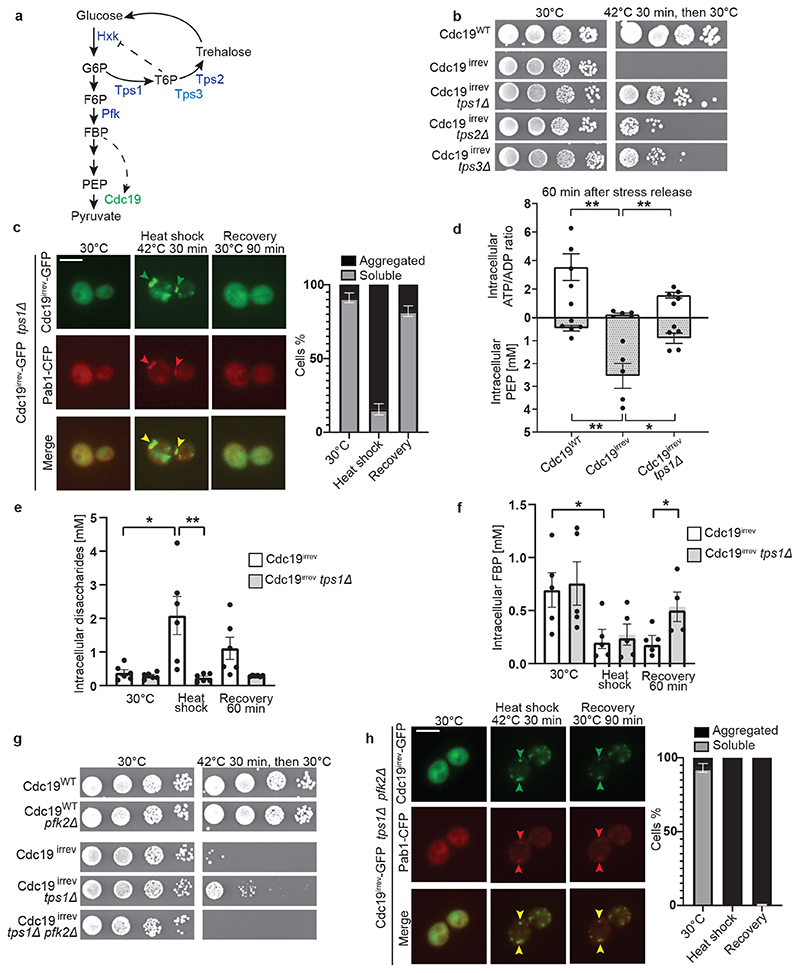
Figure 3. Re-solubilization of Cdc19 amyloids and cell cycle restart after stress are regulated by the glycolytic metabolite FBP.
(A) Representation of glycolysis and trehalose metabolism. Abbreviations: glucose-6-phosphate (G6P), fructose-6-phosphate (F6P), fructose-1,6-bisphosphate (FBP), phosphoenolpyruvate (PEP), trehalose-6-phosphate (T6P), hexokinase (Hxk), trehalose synthase (Tps) and phosphofructokinase (Pfk).
(B) Serial dilutions of the indicated strains were spotted on agar plates before or after heat shock (42°C, 30 min) and grown at 30°C for 3 days (n = 3 independent experiments).
(C) cdc19irrev tps1Δ cells expressing Pab1-CFP were heat shocked (42°C, 30 min) and recovered at 30°C. Plots indicate mean percentage (%) of cells with Cdc19 aggregates ± S.E.M (n = 3 independent experiments, >30 cells per sample per experiment). Scale bar: 5 μm.
(D) Intracellular ATP/ADP ratio and phosphoenolpyruvate (PEP) were measured in the indicated strains after heat shock (42°C, 30 min) and 60 min recovery at 30°C. Mean ± S.E.M. is shown (n = 5 independent experiments, two-tailed Mann-Whitney test, cdc19WT–cdc19irrev comparison: PATP/ADP = 0.0079, cdc19irrev-cdc19irrevtps1Δ comparison: PATP/ADP = 0.0079, PPEP = 0.0556).
(E) – (F) Intracellular disaccharides (E) (representing trehalose [46]) and FBP (F) were measured in the indicated strains before, during and after heat shock (42°C, 30 min). Mean ± S.E.M. is shown (n = 6 independent experiments for disaccharides, n = 5 independent experiments for FBP, two-tailed Mann-Whitney test, cdc19irrev 30°C–HS comparison: PDisaccharides = 0.0152, PFBP = 0.0317, cdc19irrev-cdc19irrevtps1Δ HS comparison: P Disaccharides = 0.0022, cdc19irrev-cdc19irrevtps1Δ recovery 60 min comparison: P FBP = 0.0317).
(G) Serial dilutions of the indicated strains were spotted on agar plates before or after heat shock (42°C, 30 min) and imaged after 3 days at 30°C (n = 3 independent experiments).
(H) tps1Δ pfk2Δ cells expressing Pab1-CFP and GFP-tagged Cdc19irrev were heat shocked (42°C, 30 min) and recovered at 30°C. The intensity of the GFP and CFP images before heat shock was adjusted for better visualization. Plot indicates mean percentage (%) of cells with Cdc19 aggregates ± S.E.M (n = 3 independent experiments, >30 cells per sample/experiment). Scale bar: 5 μm. Source data for graphical representations are found in Source Data Fig. 3.

