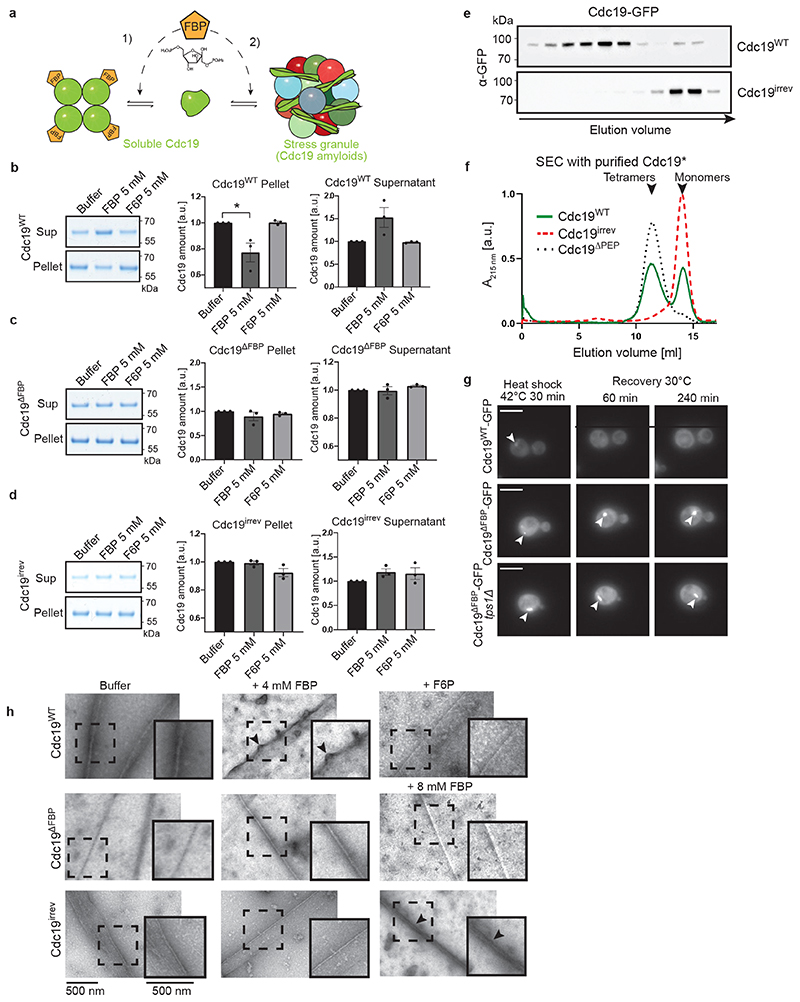
Figure 4. FBP directly regulates formation and disassembly of reversible Cdc19 amyloids.
(A) Illustration of how FBP binding may regulate Cdc19 amyloid formation and disassembly. FBP (1) depletes aggregation-prone monomers by inducing Cdc19 tetramerization [4], and (2) directly promotes aggregate re-solubilization.
(B) – (D) Purified Cdc19WT (B), Cdc19ΔFBP (C) or Cdc19irrev (D) proteins were mixed with the indicated metabolites and incubated at 30 °C for 14 hours. After centrifugation, the supernatant (Sup) and pellet (Pellet) fractions were analysed by SDS-PAGE and quantified relative to buffer controls (shown as mean ± S.E.M, n = 3 independent experiments, two-tailed t-test, P = 0.0342).
(E) – (F) Cdc19irrev is monomeric in vivo and in vitro. (E) Extracts from cells expressing GFP-tagged Cdc19WT or Cdc19irrev were separated by size-exclusion chromatography (SEC) and selected peak fractions were analysed by Western blot with an α-GFP antibody. Elution volume (ml) and size markers (kDa) are indicated. (F) Recombinant Cdc19WT, Cdc19irrev and for control tetrameric Cdc19ΔPEP mutant proteins were purified and analysed by SEC. Normalized absorbance at 215 nm(arbitrary units; a.u.) was plotted as a function of elution volume (ml). n = 3 independent experiments.
(G) Direct FBP binding to Cdc19 is necessary to re-solubilize Cdc19 amyloids in vivo. Wild-type or tps1Δ cells expressing GFP-tagged Cdc19WT or Cdc19ΔFBP and over-expressing Pyk2 were heat shocked (42 °C, 30 min) and allowed to recover at 30 °C in the presence of 25 μg/ml cycloheximide. Representative GFP-images (three independent experiments) were taken 60 or 240 min after heat shock. Arrowheads indicate Cdc19-GFP aggregates. Scale bars: 5 μm.
(H) Heat shock-induced (42 °C, 10 min) Cdc19WT, Cdc19ΔFBP and Cdc19irrev amyloids were incubated with FBP (4 or 8 mM) or for control with F6P (4 mM) or buffer. Scale bar: 500 nm. Black arrows mark fibrils that became positively stained due to FBP binding. Representative fibrils (dashed squares) were 1.5 x enlarged to better visualize distinct fibril morphologies (inserts). n = 3 independent experiments. Unprocessed original scans of gels and blots and source data for all graphical representations are shown in Source Data Fig. 4.

