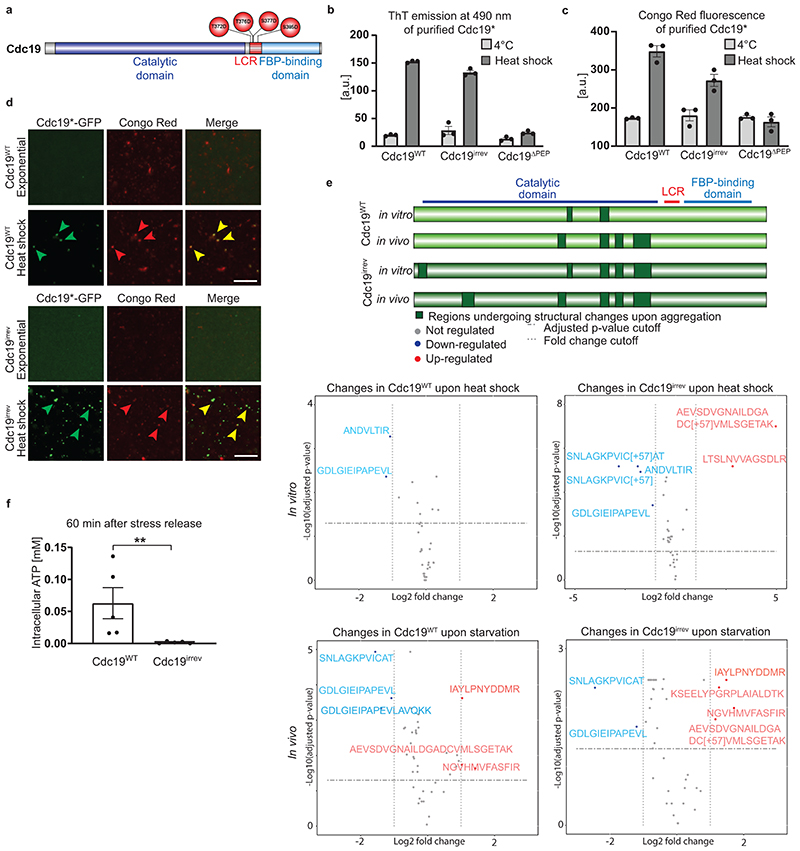
Extended Data Fig. 1. Cdc19 aggregates are amyloids both in vitro and in vivo .
(A) Schematic representation of the domains of Cdc19. The four mutated residues located within the LCR in the Cdc19irrev mutant are indicated (red circles).
(B)-(C) Both Cdc19WT and Cdc19irrev form ThT- and Congo Red (CR)-positive aggregates upon heat shock in vitro. Purified Cdc19WT, Cdc19irrev and a non-aggregating Cdc19 mutant as negative control (Cdc19ΔPEP [4]) were incubated with ThT (B) or CR (C) at 4 °C or after heat shock (42 °C, 10 min). Fluorescence emission was measured at 490 nm or 614 nm, respectively. Graphs show mean ± S.E.M. of three independent experiments (two-tailed t-test, ThT: PWT = 0.0000149, Pirrev = 0.0091, CR: PWT = 0.0003, Pirrev = 0.0128).
(D) In vivo-formed Cdc19WT and Cdc19irrev aggregates are CR-positive. Cells expressing GFP-tagged Cdc19WT or Cdc19irrev were harvested when exponentially growing or after heat shock (42 °C, 30 min) and lysed. Cdc19-GFP was immobilized in a GFP-trap microfluidic chamber and stained with CR. GFP and CR signals were detected by fluorescence microscopy, and merged to visualize co-localization. Arrowheads indicate CR-positive Cdc19-GFP aggregates. Images are representative of three independent experiments. Scale bar: 10 μm.
(E) Limited-Proteolysis Mass Spectrometry (LiP-MS) results indicate that Cdc19WT and Cdc19irrev undergo comparable structural transitions upon aggregation in vitro and in vivo. Purified soluble or aggregated (42 °C, 10 min) Cdc19WT or Cdc19irrev, as well as cell extracts obtained from cells expressing Cdc19WT-GFP or Cdc19irrev-GFP harvested during exponential growth or stationary phase (2 days) to induce aggregation were analysed by LiP-MS as described in the Methods (n = 3 independent experiments). Peptides detected in soluble and aggregated Cdc19WT and Cdc19irrev are displayed in volcano plots, and upregulated (red) or downregulated (blue) conformation-sensitive peptides are highlighted. Conformation-specific LiP-MS-peptides detected in vitro and in vivo were mapped to the Cdc19 schematic drawing (green).
(F) Intracellular ATP levels (mM) were determined in the indicated strains after heat shock (42 °C, 30 min) and recovery (30 °C, 60 min). Mean ± S.E.M. of n = 5 independent experiments is shown (two-tailed Mann-Whitney test, P = 0.0079). Source data for all graphical representations are found in Source Data Extended Data Fig. 1.

