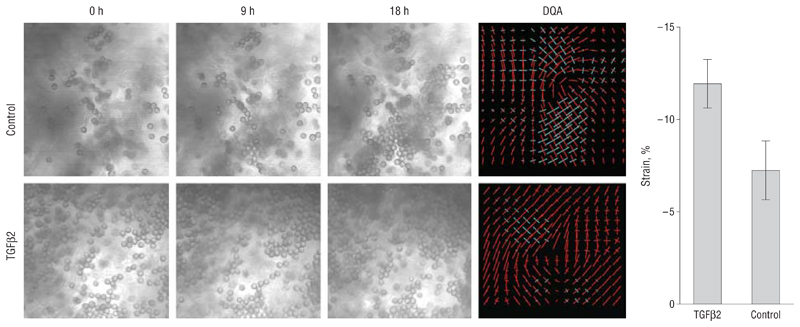
Figure 2.
Growth factor stimulation induces ex vivo microscopic tissue contraction. Images were extracted at the times indicated from movies for a representative control sample (Control) and a sample injected with transforming growth factor β2 (TGFβ2). On the right is the corresponding Deformation Quantification and Analysis (DQA) of strain distribution at individual analysis grid points, with the length of the vectors reflecting the absolute value of the strain and the color coding indicating the direction of the strain (red, contraction; blue, expansion). While the control sample is largely equilibrated in red and blue, the TGFβ2 sample is mostly red, reflecting the greater contractile strain in the sample. The graph shows the SEM strain value per analysis grid point for 4 control samples and for 3 TGFβ2 samples. P< .001, t test.

