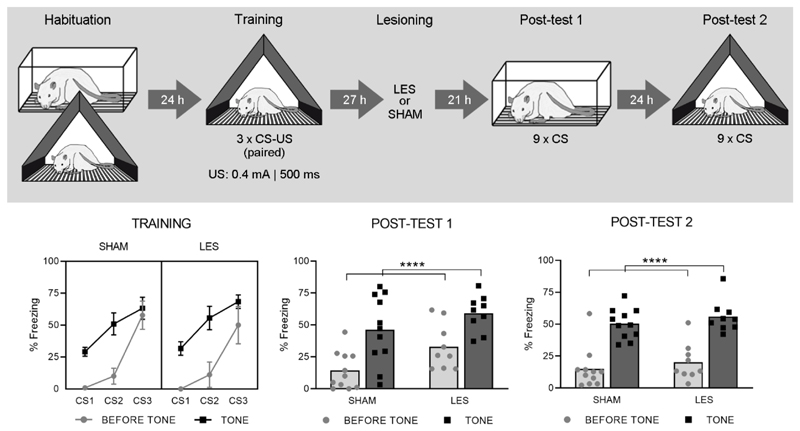
Fig. 4. Experiment 3.
The upper panel shows the experimental design. The lower left panel shows percentage freezing during each CS (tone) and its preceding 10-s interval (before tone), for both SHAM (n = 11) and LES (n = 9) groups during Training (means ± SEM). The lower middle and right panels show freezing during these same intervals, for Post-test 1 and 2 respectively (shown as individual data points with mean). Main effect of Trial: ****p < .0001.

