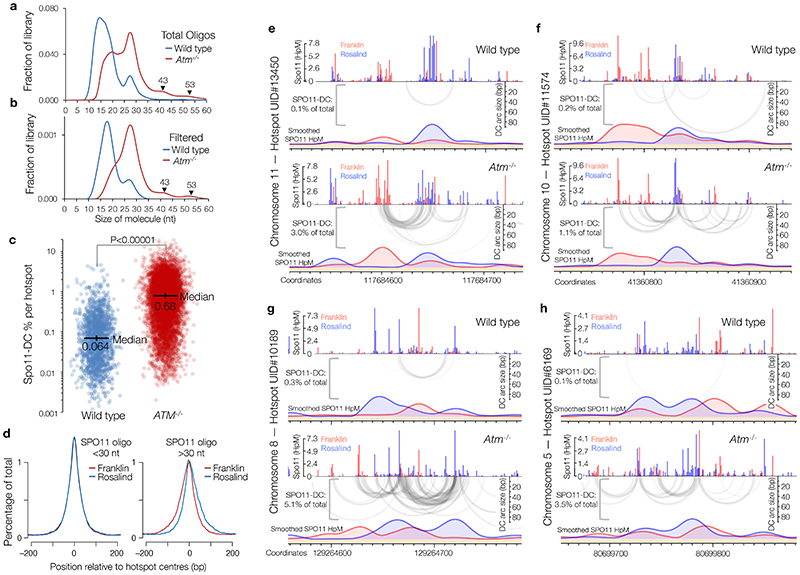
Extended Data Figure 6. Fine-scale analysis of SPO11-DCs within mouse DSB hotspots.
Mouse SPO11-oligo libraries4 were remapped using paired-end Bowtie2 alignment. a-b, SPO11-oligo length distribution of the entire library (a), or after applying the 2 bp overlap filter (b) as in Fig.2a, upper cartoon. Filtering was less efficient than in yeast (see Methods), retaining numerous molecules <30 nt, that, based upon our analysis in yeast, are likely to be a filtering artefact. Therefore, as for S. cerevisiae, SPO11-DCs are defined as filtered molecules >30 nt in length. Filtering retains weak peaks in Atm -/- that display a ~10 bp periodicity. c, Percentage of total SPO11 oligos that are SPO11-DCs based on overlap filtering, plotted for every hotspot where filtered Spo11-DCs were detected (n=1831 in wild type; n=8010 in Atm -/-). P value indicates two-tailed Kruskal-Wallis H-test. d, Total Atm -/- SPO11 oligos were filtered into two size classes then aggregated around ~21,000 hotspot centres revealing a strand-specific disparity for Spo11-oligos >30 nt. e-h, Representative arc diagrams of SPO11-DCs (grey-scale frequency-weighted arcs) in wild-type and Atm-/- relative to total strand-specific SPO11 oligos (upper, raw; lower, smoothed; red, Franklin strand; blue, Rosalind strand). Percentage of total SPO11 oligos that are SPO11-DCs is indicated. Unlike in Atm -/-, SPO11-DCs in wild type often did not coincide with strong SPO11-oligo signals, suggesting that some may arise from additional artefacts of the filtering.

