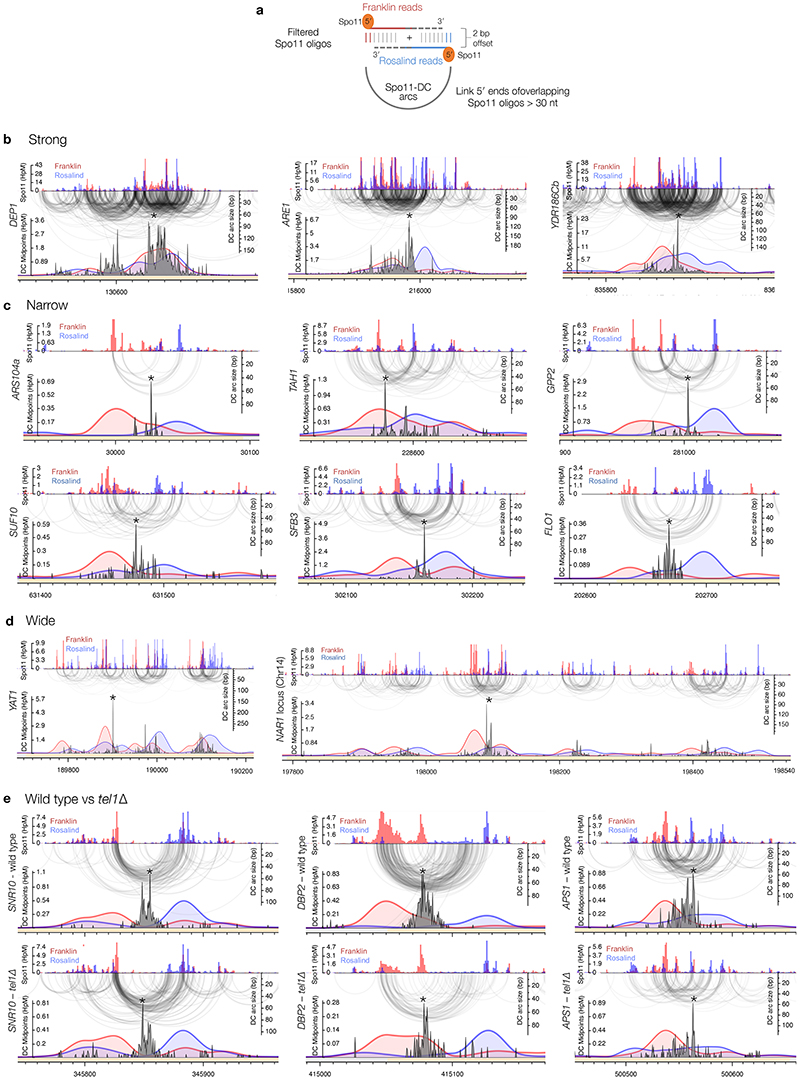
Extended Data Figure 4. Fine-scale patterns of S. cerevisiae Spo11-DCs within DSB hotspots.
a, Spo11-DC arcs link the 5′ ends of overlapping Franklin- and Rosalind-strand filtered reads. For all bioinformatic analyses, only overlapping read pairs >30 nt are considered because this is the minimum length of Spo11-DCs detected physically (Fig.1c). We believe that enrichment of some shorter overlapping pairs arises from the artefactual overlap of canonical oligos (<30 nt) within dense hotspot regions. b-e, Arc diagram depiction of Spo11-DCs mapped across example hotspots encompassing strong (b), narrow (c), and wide (d) classes, presented as in Fig.2e-f. Top panel: unfiltered strand-specific Spo11 oligos (Franklin-strand, red; Rosalind-strand, blue; HpM, hits per million mapped reads). Arcs (grey-scale frequency-weighted) link 5′ ends of each Spo11-DC. Lower panel: smoothed unfiltered strand-specific Spo11-oligos, overlaid with frequency histogram of Spo11-DC midpoints (grey). The left flanks of Spo11-DC peaks are enriched for Franklin-strand hits, whereas the right flanks are enriched for Rosalind-strand hits. This relationship was visualised most easily at narrow, low frequency hotspots where Spo11-DC patterns were less complex. In (e), wild-type and tel1Δ data are compared for the same hotspots. Whilst TEL1 deletion does have subtle effects on the pattern and abundance of both Spo11 oligos and Spo11-DCs, it did not alter the asymmetric pattern of Spo11-oligo strand disparity that is associated with regions of preferential Spo11-DC formation. Please note that in all plotted Spo11-oligo and Spo11-DC maps, Rosalind-strand signals are shifted by 1 bp to the left so that differences between the abundance of F- and R-mapping reads at individual cleavage sites can be more directly compared.

